One Can Only Imagine the Richness of the Gold Which May Be brought to light in this very aggressive drilling program just announced.
Needless to say,
Wallbridge Mining has the stuff to be a potential kingmaker. The fact the share price is as idiotically low as it is underscores the height to which it may rise when price discovery is permitted to proceed by virtue of this drilling program.
Markets are nowhere more episodically irrational than in the junior gold explorers and nowhere is there in the markets any other sector with such astounding potential.
I believe that this company is going to uncover gold sufficient to establish
Wallbridge Mining as one of the great Canadian gold success stories.
The greatest good fortune to all present
Wallbridge Mining shareholders and those now doing their due diligence which will lead them to join our ranks.
Wallbridge Commences 20,000-metre Regional Drill Program on its 910 km2 Detour-Fenelon Land Package starting at the Martinire Gold Property Toronto, Ontario – July 22, 2021 – Wallbridge Mining Company Limited (TSX:WM) (
"Wallbridge" or the
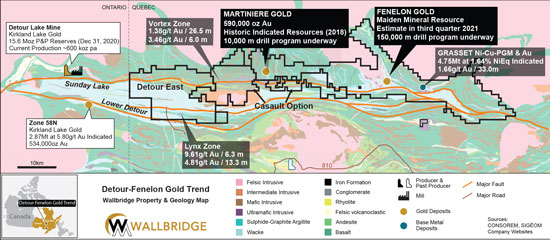
"Company") is pleased to announce that it is initiating a 20,000-metre regional drill program, part of the Company's planned 170,000-metre 2021 drill program, starting at the Martinire Gold Project ("Martinire" or the "Property"), located 30 kilometres west of its flagship Fenelon Gold Property ("Fenelon") and 45 kilometres east of Kirkland Lake Gold's Detour Lake Gold mine (see Fig. 1).
Located in Qubec's northern Abitibi Greenstone Belt, the Detour-Fenelon Gold Trend has demonstrated potential for world-class gold deposits, yet it remains highly underexplored in comparison to the other prolific gold belts in the southern portion of the Abitibi, like the Timmins-Porcupine, Kirkland Lake and Val d'Or camps. Spanning 97 kilometres in east-west direction within this belt (roughly equivalent to the distance between Rouyn-Noranda and Val d'Or), Wallbridge's extensive, 910 km
2 regional Detour-Fenelon land package offers excellent potential for new gold discoveries and the Company has selected Martinire as its second priority area after Fenelon.
Martinire has a historic indicated resource of approximately 591,000 gold ounces, reported by the previous owner, Balmoral Resources (
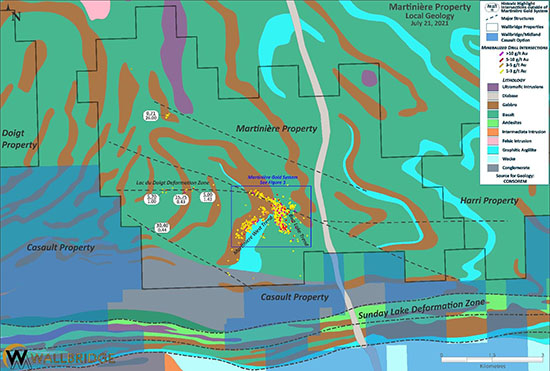
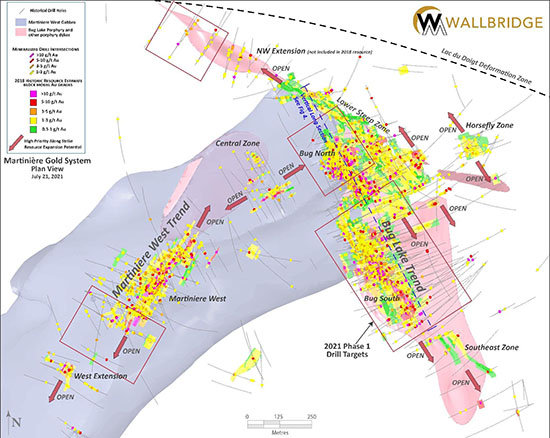
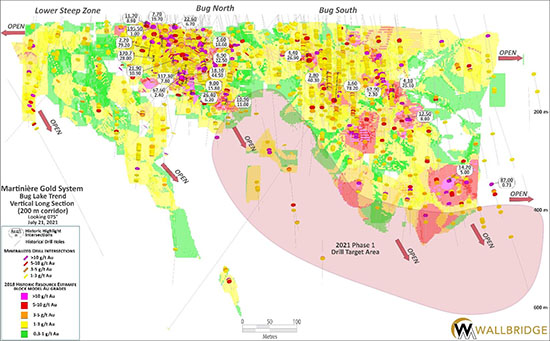
"Balmoral") in March 2018 (see details in Table 2). The mineralization extends over a known area of approximately 2 by 1.8 kilometres and has been traced down to 700 metres vertical depth by sporadic drill holes (see Figs. 2, 3 and 4). Most of the drilling, however, is restricted to the top 300 metres from surface and the Company believes there is excellent potential to expand the known zones both along strike and down-plunge.
A review of the geology and the controls on gold deposition at Martinire, has identified a number of attractive exploration targets and opportunities for expansion of the historic resource.
"We are very excited to kick-off our regional exploration program on Martinire, our second most advanced gold project after Fenelon," stated Marz Kord, President & CEO of Wallbridge. "The quality of the gold mineralization at Martinire, as highlighted by the historic intersections reported in Table 1, shows many similarities to our Fenelon gold system and gives us confidence that we can replicate the discovery success we have achieved at Fenelon. All the zones remain open along strike and at depth with very little drill testing below 300 metres vertical depth." "Our team has completed a detailed review of the historic data, as well as re-interpretation and 3D modelling of the geology at Martinire in preparation for this initial drill program and an updated Martinire mineral resource estimate that is to be reported along with the Fenelon maiden mineral resource estimate," explained Attila Pntek, Vice President Exploration of Wallbridge. "Previous operators, especially Balmoral Resources, have demonstrated that Martinire hosts an extensive gold system over a footprint of several kilometres in diameter and we now have the opportunity to build on this past work to thoroughly evaluate this prospective property." Planned 2021 Regional Drill Program A surface drill rig was mobilized to the Property this week with plans to complete an approximate 10,000-metre Phase 1 drill program focusing on the following:
- Near-surface targets to extend known mineralized zones along strike with the objective of increasing the open pit portion of the mineral resource (see Fig. 3);
- Targets at depth to follow known high-grade shoots to depth and thereby increasing the underground, high-grade resource potential (see Fig. 4);,
- High-priority geological-geophysical targets and isolated historical gold intersections property-wide to discover new mineralized gold zones (see Fig. 2).
The Phase 1 drill program is expected to be completed by the end of October, and the results will be used to prioritize drill targets for a Phase 2 drill program, which will commence right after Phase 1, or in early 2022.
In early August, a second regional drill rig will be mobilized to the Casault Project, which is under option from Midland Exploration Inc., to test drill targets within 5 kilometres west of Martinire and to carry out drilling on other regional exploration targets.
About the Martinire Gold Project Martinire is located within Wallbridge's 910 km
2 Detour-Fenelon Gold Trend land package, which extends over 97 kilometres in an East-West direction along the Sunday Lake Deformation Zone ("SLDZ"), a major structure that controlled the emplacement of Kirkland Lake Gold's Detour Lake deposit, 45 kilometres west of Martinire, and the Company's Fenelon Gold System, located 30 kilometres to the east of Martinire (see Fig. 1).
Gold on the Martinire project was discovered in 1997 by Cyprus Canada Inc. and subsequently the property was explored by International Taurus Resources Inc. and American Bonanza. Balmoral acquired Martinire in November 2010 and, from 2011 to 2017, drilled over 130,000 metres and reported an initial mineral resource estimate in March 2018. Their work expanded the historical intercepts on the project into the Bug and Martinire West gold deposits and identified several additional zones and showings, including VMS mineralization.
The Martinire Gold System extends over a known area of approximately 2 by 1.8 kilometres and has been traced down by sporadic drill holes to 700 metres vertical depth, with most drilling, however, focusing only on the top 300 metres from surface. The gold system is divided into the Bug deposits (Bug Lake North and South), which were emplaced along the Bug Lake Porphyry; the Martinire West deposit, hosted by a gabbroic intrusion; and other less explored mineralized zones along strike or near these deposits (Horsefly Zone, Central Zone, NW Extension and others) (see Fig. 3).
The Martinire Gold System is most likely part of the orogenic class of gold deposits and high-grade, structurally controlled gold mineralization is generally surrounded by a broader, lower grade halo. Table 1 compiles highlight historic drill results (> 100 metal factor; metal factor = gold grade multiplied by core length) from Balmoral's drill programs completed between 2011 and 2017.
Table 1. Martinire Highlight Drill Results (> 100 Metal Factor) from 2011-2017 Drilling by Balmoral Resources | Hole ID | From (m) | To (m) | Length (m) | Au (g/t) | Metal Factor (1) |
| MDE-14-143 | 88.30 | 116.40 | 28.00 | 170.70 | 4785 |
| MDE-12-29 | 166.00 | 173.80 | 7.80 | 117.30 | 913 |
| MDE-15-166 | 118.80 | 163.20 | 44.50 | 18.10 | 806 |
| MDE-15-170 | 105.50 | 116.40 | 10.90 | 21.90 | 240 |
| MDW-13-88 | 97.30 | 123.30 | 26.00 | 9.10 | 237 |
| MDE-12-39 | 35.60 | 36.50 | 1.00 | 195.50 | 190 |
| MDW-11-04 | 80.30 | 100.70 | 20.40 | 8.80 | 180 |
| MDE-14-145 | 59.00 | 138.20 | 79.20 | 2.20 | 176 |
| MDW-11-17 | 52.50 | 74.00 | 21.50 | 7.80 | 167 |
| MDE-12-60 | 172.40 | 174.80 | 2.40 | 67.60 | 165 |
| MDE-13-122A | 186.60 | 192.80 | 6.20 | 26.40 | 164 |
| MDE-16-205 | 202.20 | 204.50 | 2.30 | 67.90 | 157 |
| MDW-11-01 | 106.00 | 118.00 | 12.00 | 12.90 | 155 |
| MDE-15-173 | 119.10 | 141.60 | 22.50 | 6.90 | 154 |
| MDE-12-72 | 25.70 | 32.50 | 6.70 | 22.60 | 152 |
| MDE-12-65 | 60.60 | 80.30 | 19.70 | 7.70 | 151 |
| MDE-15-175A | 172.00 | 187.70 | 15.80 | 9.00 | 142 |
| MDE-12-56 | 106.00 | 107.00 | 1.00 | 138.00 | 138 |
| MDE-16-242A | 162.20 | 240.40 | 78.20 | 1.60 | 127 |
| MDE-15-184 | 74.90 | 83.40 | 8.50 | 14.70 | 125 |
| MDW-11-19 | 135.50 | 164.10 | 28.60 | 4.20 | 121 |
| MDE-15-168 | 199.40 | 210.40 | 11.00 | 10.90 | 120 |
| MDE-16-221 | 110.90 | 137.80 | 26.90 | 4.40 | 118 |
| MDE-14-143 | 395.30 | 402.80 | 7.50 | 15.50 | 116 |
| MDE-16-218 | 148.70 | 189.00 | 40.30 | 2.80 | 112 |
| MDE-12-20 | 41.00 | 50.30 | 9.30 | 11.30 | 105 |
| MDE-12-83 | 18.10 | 27.00 | 8.90 | 11.70 | 105 |
| MDE-11-01 | 57.00 | 75.60 | 18.60 | 5.60 | 104 |
| MDW-11-24a | 120.70 | 124.40 | 3.70 | 27.50 | 103 |
| MDE-16-216 | 206.40 | 231.50 | 25.10 | 4.10 | 103 |
| MDW-11-22 | 67.50 | 68.90 | 1.40 | 74.50 | 101 |
| MDW-11-30 | 142.00 | 144.30 | 2.30 | 43.40 | 101 |
| MDE-14-147 | 288.30 | 296.30 | 8.00 | 12.50 | 100 |
1 gold grade multiplied by core length
2018 Historic Resource Estimate and Updated NI 43-101 Resource Estimate Balmoral reported a mineral resource estimate for the Martinire project in March 2018, which was prepared by Ginto Consulting Inc. (Vancouver, BC) and included separate estimates for the Bug and Martinire West gold deposits (see Table 2).
These "Resources" are deemed historic and should not be relied upon. The qualified persons of the March 2021 Technical Report (see
Technical Report filed on March 18, 2021 on SEDAR) have not done sufficient work to classify the historical estimate as current mineral resources or mineral reserves. Although they comply with current NI 43-101 requirements and follow CIM Definition Standards, they are included for illustrative purposes only and the Company is not treating the historical estimate as current mineral resources.
The Company has retained InnovExplo to complete an updated mineral resource estimate on the Property which is expected to be published along with the Fenelon maiden mineral resource estimate in the third quarter of 2021.
Table 2. Martinire 2018 Historic Mineral Resources | | INDICATED | INFERRED | |
Au Cut-Off
(g/t) | Tonnage
(tonnes) | Au Grade
(g/t) | Content
(oz) | Tonnage
(tonnes) | Au Grade
(g/t) | Content
(oz) | Strip Ratio |
| OPEN PIT MINERAL RESOURCES |
| 0.5 | 6.827,183 | 1.96 | 431,225 | 132,147 | 2.50 | 10,622 | 11.6 |
| UNDERGROUND MINERAL RESOURCES |
| 2.5 | 1,092,415 | 4.54 | 159,417 | 231,273 | 5.75 | 42,722 | |
| TOTAL RESOURCES AT PREFERRED CUT-OFFS |
| 0.5/2.5 | 7,919,598 | 2.32 | 590,642 | 363,420 | 4.57 | 53,344 | |
The assumptions and notes which accompany this initial resource estimate are listed below:
- The Independent and Qualified Person for the Mineral Resource Estimate, as defined by NI 43101, is Mr. Marc Jutras, P.Eng., M.A..Sc., Principal of Ginto Consulting Inc. The effective date of the Estimate is March 27, 2018.
- These mineral resources are not mineral reserves as they do not have demonstrated economic viability.
- While the results are presented undiluted, the reported mineral resources are considered to have reasonable prospects for eventual economic extraction. The near surface mineral resource is constrained within an optimized open pit shell, while the below pit portion of the mineral resource is reported at an elevated gold grade cut-off.
- The estimate includes several discrete zones/sub-zones of mineralization.
- Resources were compiled at gold cut-off grades of 0.5, 0.7 and 1.0 g/t gold for the evaluation of open pit estimates and at 2.0, 2.5 and 3.0 g/t gold for evaluation of underground estimates (see table below). The base case resource estimate is reported at a cut-off grade of 0.5g/t gold for resources constrained within the optimized pit shell and 2.5 g/t gold for resources outside the pit shell.
- Cut-off calculations for calculating the base case resource used: (all USD figures) $1.80/t for overburden removal, $2.00/t for open pit mining, $50.00/t for underground mining, $17.00/t for Processing (for both open pit and underground scenario's), $2.50/t for G&A costs and mill recovery rates of 91%.
- Gold recovery rates of up to 91% have been achieved in limited testing for the Bug deposit. The Bug deposit comprises the majority of the estimated resource. Gold recoveries of.up to 97% to concentrate, and 72% overall, have been achieved in preliminary testing of theMartinire West Deposit.
- For the open pit scenario pit slopes of 50 degrees were assumed in bedrock and 25 degrees in overburden.
- Calculations used a USD/CAD exchange rate of 1.22 and a gold price of US$1,300 in keeping with current long-term consensus estimates.
- Cut-off grade calculations would have to be re-evaluated in light of future prevailing market conditions (metal prices, exchange rate, and mining costs).
- Density values were estimated for all lithological units from measured samples. Density values for the mineralized zones were calculated from a measured density database.
- The resource was estimated using Vulcan software. The estimate is based on results from 490 diamond drill holes (91,988 m). The cut-off date for the drill hole database is January 30, 2018.
- High grade capping was done on composited assay data and established on a per zone basis.
- Compositing was done on drill hole intercepts falling within the mineralized zones (composite length of 1.0 m).
- Resources were evaluated from composited and capped drill hole assays using 3-pass ordinary kriging and inverse distance squared interpolation methods in a block model (block size = 2.5 x 2.5 x 2.5 m).
- The Mineral Resources presented herein are categorized as Indicated and Inferred based on drill spacing and geological and grade continuity. Based on the nature of the mineralization, a maximum average distance of composites of 40 m was used for Indicated resources in the Bug Deposit and 35 m in the Martinire West Deposit.
- Ounce (troy) = metric tonnes x grade / 31.10348. Calculations used metric units (metres, tonnes and g/t). Metal contents are presented in ounces.
- The number of metric tonnes and contained ounces were rounded to the nearest thousand. Any discrepancies in the totals are due to rounding effects
- The quantity and grade of reported Inferred resources in this Mineral Resource Estimate are uncertain in nature and there has been insufficient exploration to define these Inferred resources as Indicated or Measured, and it is uncertain if further exploration will result in upgrading them to these categories.
- CIM definitions and guidelines for mineral resources have been followed.
 Figure 1. Overview Map of Wallbridge's Detour-Fenelon land package
  Figure 2. Geology Map of the Martinire Property
  Figure 3. Plan view of the Martinire Gold System
  Figure 4. Vertical Long Section of the Bug Lake Trend Assay QA/QC and Qualified Persons
 Drill core samples from Balmoral's drill programs at Martinire were all submitted for analysis to ALS Canada Ltd. Balmoral's QA/QC practices and ALS's analytical methods were described in detail in the 2018 Technical Report on the Property (see Technical Report filed by Balmoral Resources on March 29, 2018 on SEDAR).
Drill core samples from Wallbridge's 2021 drill program at Martinire are cut and bagged on site and transported to Bureau Veritas Commodities Canada Ltd. for analysis. Samples, along with standards and blanks that are included for quality assurance and quality control, were prepared and analyzed at the laboratories. Samples are crushed to 90% less than 2mm. A 1kg riffle split is pulverized to 85% passing 75 microns. 50g samples are analyzed by fire assay and AAS. Samples > 10g/t Au are automatically analyzed by fire assay with gravimetric finish or screen metallic analysis. To test for coarse free gold and for additional quality assurance and quality control, Wallbridge requests screen metallic analysis for samples containing visible gold. These and future assay results may vary from time to time due to reanalysis for quality assurance and quality control.
The Qualified Person responsible for the technical content of this press release is Peter Lauder, P.Geo, Exploration Manager of Wallbridge.
About Wallbridge Mining Wallbridge is currently advancing the exploration and development of its 100%owned Fenelon Gold property which is located along the DetourFenelon Gold Trend, an emerging gold belt in northwestern Qubec. The Company completed approximately 102,000 metres of drilling in 2020 and has begun a fullyfunded 2021 program of approximately 170,000 metres of drilling (including a 20,000-metre regional drill program exclusive of Fenelon) and 2,500 metres of underground exploration development (Phase 1 of a 10,000-metre program). The Company intends to complete a maiden mineral resource estimate on the Fenelon Gold System in the third quarter of 2021.
Wallbridge now holds several kilometres surrounding its rapidly expanding Fenelon discovery providing room for growth, as well as future mine development flexibility. Wallbridge's land holdings in Qubec along the DetourFenelon Gold Trend are 910 km
2, improving Wallbridge's potential for further discoveries for over 97-kilometre strike length in this underexplored belt.
Wallbridge is also the operator of, and a 17.8% shareholder in, Lonmin Canada Inc., a privatelyheld company with a portfolio of nickel, copper, and platinumgroup metals (PGM) projects in Ontario's Sudbury Basin.
This news release has been authorized by the undersigned on behalf of Wallbridge Mining Company Limited.
For further information please visit the Company's website at
www.wallbridgemining.com or contact:
Wallbridge Mining Company Limited Marz Kord, P. Eng., M. Sc., MBA
President & CEO
Tel: (705) 6829297 ext. 251
Email:
mkord@wallbridgemining.com Victoria Vargas, B.Sc. (Hon.) Economics, MBA
Investor Relations Advisor
Email:
vvargas@wallbridgemining.com