ENB's Risk Profile Includes
- Executing on the long-term transition to a green energy economy
- Regulatory/political risk (such as project approval and carbon taxes)
- Project completion risk
- Litigation risk (including project approval and environmental cleanup costs in case of accidents)
- Industrial accidents
- Talent retention risk
How We Monitor ENB's Risk Profile
- 24 analysts
- 4 credit rating agencies
- 8 total risk rating agencies
- 32 experts who collectively know this business better than anyone other than management
(Source: June investor presentation)
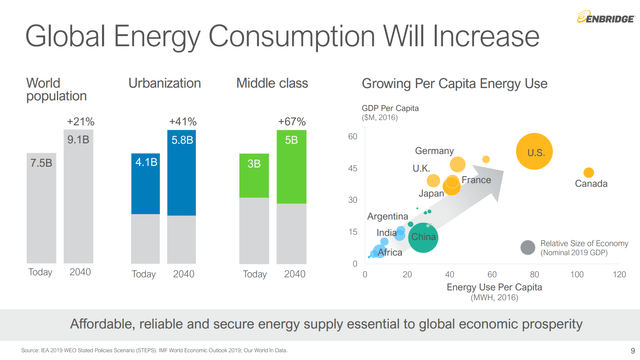
The global energy transition is expected to take decades, not years.
(Source: ENB SLB investor presentation)
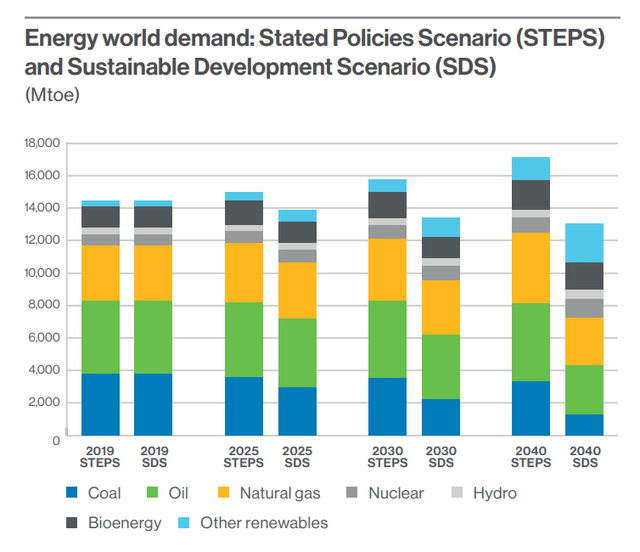
Even if the world made herculean efforts at decarbonization the IEA estimates that global oil and gas demand by 2040 would fall about 5%.
(Source: June investor presentation)
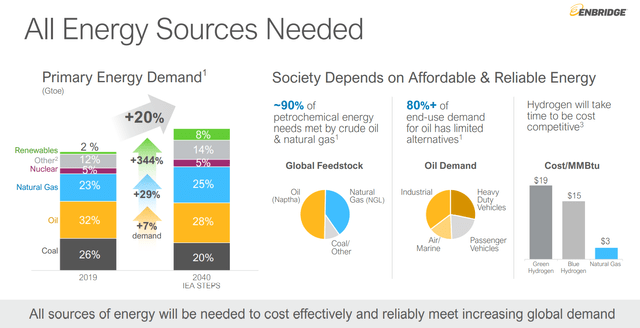
By 2040, the IEA actually expects, based on current policies being discussed, for oil and gas demand to rise by 7% and 29%, respectively. But that doesn't mean that Enbridge's cash flow is at risk, not even over several decades.
(Source: FactSet Research Terminal)
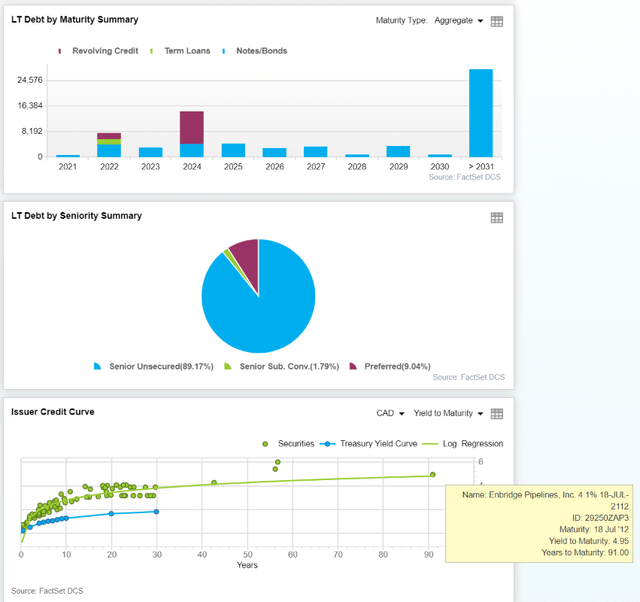
The bond market is willing to lend to ENB for not just 30 years, not just 40 years or 55 years, but 91 years at sub 5% interest rates. The "smart money" on Wall Street is confident that ENB will be around in 100 years.
As part of a larger US$1.5 billion financing, the company issued a US$1 billion 12-year term senior note which is consistent with our recently published SLB (Sustainable linked bond) Framework, incorporating emissions and inclusion goals into the financing terms. The SLB carries a coupon of 2.5%. Enbridge also closed a 30-year US$500 million term senior note issuance with a coupon of 3.4%." - ENB press release
For context, a 12-year bond with a 2.5% interest rate is the lowest long-term borrowing cost in the history of this industry.
And a 30-year regular bond at 3.4% interest shows the bond market loves Enbridge and is confident in its plan for transitioning to a green energy future.
Enbridge: The Green Giant Of Midstream
Enbridge operates in five countries, on two continents, and is North America's 12th largest green energy producer.
Nearly 1 million homes power by ENB's wind power.
Berkshire Hathaway Energy delivers safe, reliable service each day to more than 11.8 million customers and end-users worldwide, with approximately 43% of our owned and contracted generating capacity coming from renewable and non-carbon sources.
As part of Berkshire Hathaway Energy’s expansion into the unregulated renewables market, BHE Renewables was developed to oversee solar, wind, hydro, and geothermal projects. BHE Renewables encompass BHE Solar, BHE Wind, BHE Geothermal, and BHE Hydro. These companies make Berkshire Hathaway Energy the owner of one of the largest renewable energy portfolios in the U.S." - Berkshire Hathaway Energy
Berkshire has been investing heavily into renewables, trying to cash in on a $128 trillion megatrend that Brookfield calls the single biggest investment opportunity of our lifetime.
Well, guess who else is investing heavily into renewables?
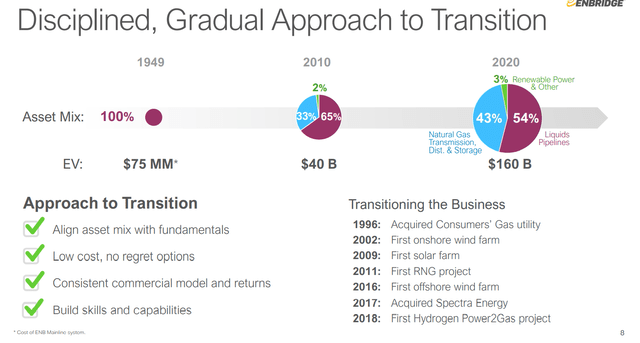
(Source: June investor presentation)
Enbridge began investing in wind and solar in 2002, and has been the industry leader ever since. So far it's invested $6.2 billion into 44 renewable energy projects and is planning on more than doubling its capacity by 2023.
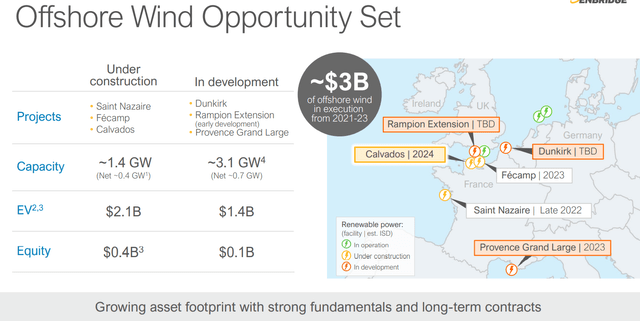
(Source: June investor presentation)
ENB's current wind backlog will approximately triple its capacity in the next two years.
But that's just a drop in the bucket compared to how large an investment opportunity this could be for Enbridge, and Berkshire if it buys it.
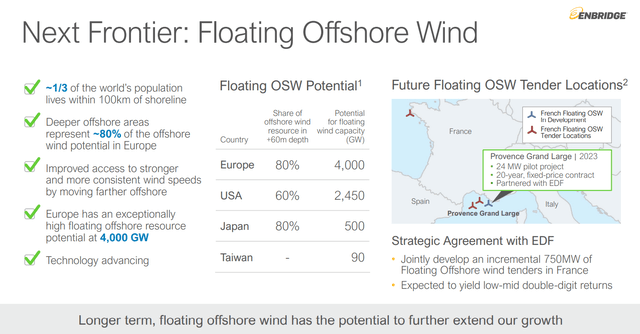
(Source: June investor presentation)
The International Energy Agency estimates that by 2040 floating offshore wind could grow by 9,500 GW, equivalent to almost 10,000 nuclear reactors worth of power.
That's 2100X larger than ENB's current wind assets.
What kind of economics is Enbridge realizing on these clean energy investments?
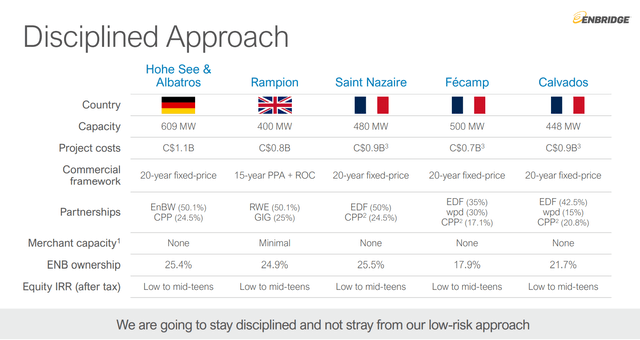
(Source: June investor presentation)
How does 10% to 15% returns on investment sound? For context, that's approximately the same profitability that ENB generates on its pipeline and other midstream assets.
(Source: June investor presentation)
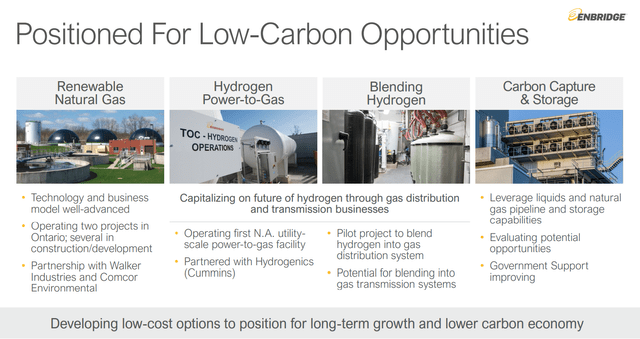
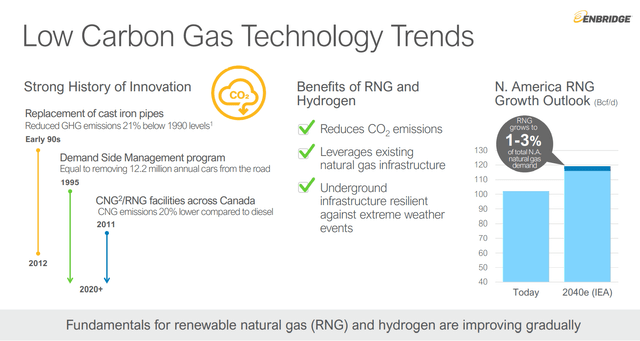
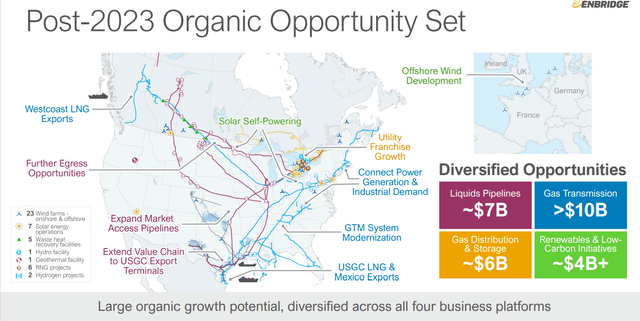
And wind power is just part of the incredible long-term opportunities ENB sees in the coming decades.
(Source: June investor presentation)
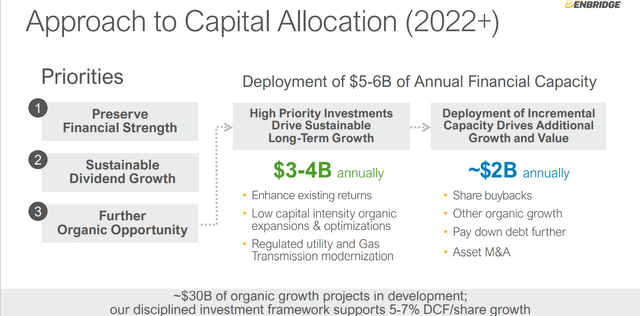
Enbridge has $24 billion more in growth projects it's considering, on top of the $13.6 billion it's completing by 2023.
(Source: June investor presentation)
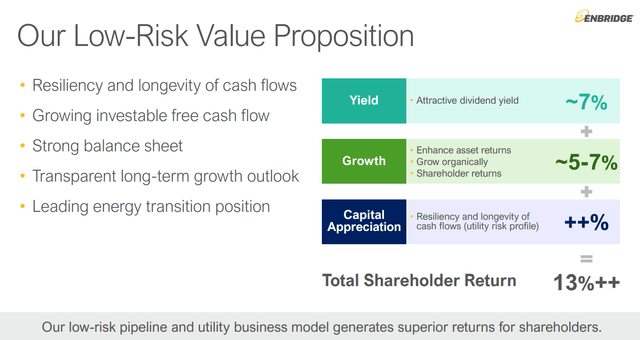
Management expects that to drive about 6% long-term cash flow growth, for decades to come.
(Source: June investor presentation)
This means about 12.6% CAGR long-term returns, 10.6% adjusted for inflation, for the foreseeable future. All from the green giant and growth king of midstream.
This brings me to the biggest reasons Buffett should consider buying Enbridge.
Reason 2: A Needle Moving Deal That Only Buffett Could Pull Off
The next few years aren't expected to be spectacular for Berkshire.
BRK Profit Growth Consensus Forecast
| Year | Sales | EBITDA | EBIT (Operating Income) | Net Income |
| 2020 | $286,093 | $39,339 | $28,743 | $42,521 |
| 2021 | $297,452 | $43,326 | $32,391 | $35,415 |
| 2022 | $297,204 | $46,645 | $35,039 | $27,588 |
| 2023 | $311,434 | $49,981 | $37,663 | $29,605 |
| Annualized Growth | 2.87% | 8.31% | 9.43% | -11.37% |
(Source: FactSet Research Terminal)
Operating profits and book value are expected to grow 9% and 7% CAGR, respectively through 2023.
The growth consensus range for BRK is 7.3% CAGR to 14% CAGR.
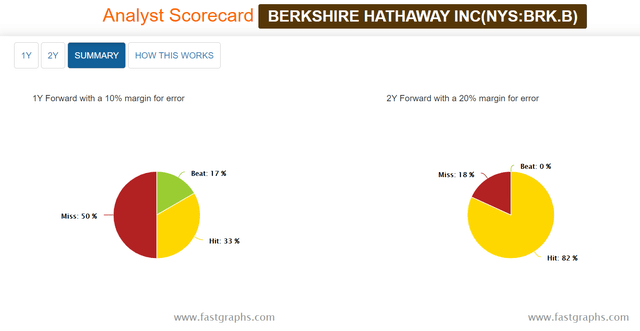
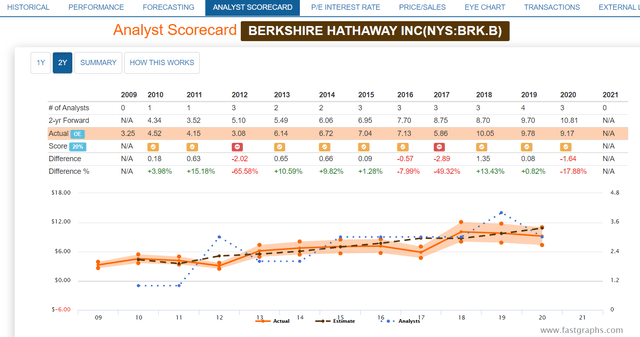
Smoothing for outliers, the historical analyst margin of error is 50% to the downside and 15% to the upside.
That means a 3% to 15% margin-of-error adjusted growth consensus range with 12% as the most robust consensus.
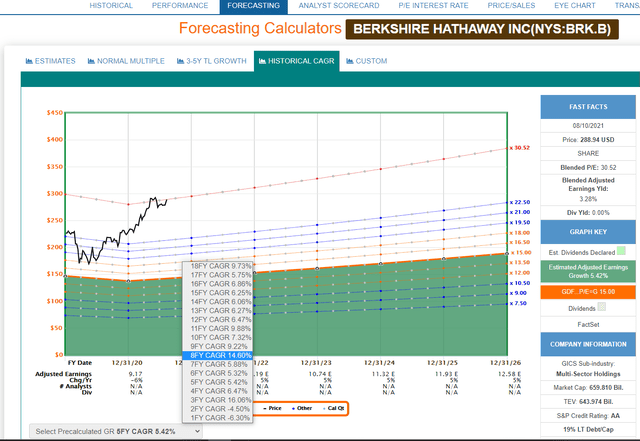
(Source: FAST Graphs, FactSet Research)
Berkshire as a growth stock? Indeed BRK has grown at high-single digits and even 15% annually for the last eight years.
To keep growing at such rates BRK needs someplace to put its mountain of cash and nearly $30 billion in annual free cash flow.
And that's where Enbridge comes in.
ENB Profit Growth Consensus Forecast
| Year | Sales | DCF | EBITDA | EBIT (Operating Income) | Net Income |
| 2020 | $30,763 | $7,430 | $10,446 | $7,525 | $3,852 |
| 2021 | $35,417 | $7,916 | $11,186 | $7,706 | $4,427 |
| 2022 | $37,105 | $8,541 | $12,179 | $8,621 | $4,888 |
| 2023 | $37,387 | $8,728 | $12,479 | $8,765 | $4,947 |
| 2024 | NA | $8,728 | $12,478 | NA | $4,603 |
| 2025 | NA | $9,104 | $13,141 | NA | NA |
| 2026 | NA | $9,227 | $13,428 | NA | NA |
| Annualized Growth | 6.72% | 3.68% | 6.11% | 5.22% | 4.55% |
(Source: FactSet Research Terminal)
By 2026, Enbridge is expected to be generating $9.2 billion in distributable cash flow, the industry equivalent of free cash flow.
That would boost BRK's annual free cash flow by about 33% in one fell swoop.
But wait it gets better.
Remember that ENB has a long-term growth backlog of $24 billion (that's growing over time).
If ENB had access to BRK's insurance float and river of free cash flow, then it could accelerate its growth plans.
What could that mean for Berkshire investors? Consider this.
Thus far ENB has been spending about $1 billion per GW of wind power capacity.
By 2040 the IEA estimates that total wind power potential in the US, Europe, and Japan, including floating offshore, will be about 9,600 GW.
That means a total potential investment opportunity as large as $9.6 trillion.
And remember that ENB is generating 10% to 15% returns on investment in wind.
- $960 billion to $1.44 trillion in annual cash flow from global wind is ENB's maximum addressable potential
BRK is a huge company, with nearly $300 billion in sales, and $29 billion in annual free cash flow. It's not easy to move the needle with such size.
But if BRK bought Enbridge and ENB's world-class management had access to vastly larger essentially free capital, then it could deliver truly incredible growth for Berkshire.
Imagine if, with BRK's mountain of cash, ENB was able to achieve 5% of the potential in global wind by 2040.
That would require approximately $480 billion, over the next 18 years (giving time to close the acquisition. That's about $27 billion per year BRK could spend on wind power, consuming an initial 71% of its combined BRK + ENB free cash flow each year.
BRK would still have a mountain of cash and be able to buy back stock opportunistically.
But by 2040 its free cash flow could increase by $48 to $72 billion per year, from $29 billion to $86 to $110 billion.
- An extra 6.2% to 7.7% CAGR FCF growth from ENB's wind potential alone
- Effectively doubling BRK's recent growth rate
That's currently how fast BRK is growing its free cash flow, and it really gets aggressive with investing in ENB's growth potential, it could achieve even faster growth.
Why Buying Enbridge Makes Sense From A Valuation Perspective
Over the past 18 months, BRK has repurchased approximately $37 billion worth of its stock.
That's made sense from a "better to buy a wonderful company at a fair price, than a fair company at a wonderful price" perspective.
BRK Market-Determined Fair Value
| Metric | Historical Fair Value Multiples (13-Years) | 2020 | 2021 | 2022 | 2023 | 12-Month Forward Fair Value |
| 13-Year Median P/BV | 1.34 | $256.41 | $286.69 | $305.12 | $328.43 | |
| Earnings | 22.17 | $203.22 | $265.71 | $277.03 | $299.89 | |
| Average | | $226.74 | $275.80 | $290.40 | $313.51 | $284.50 |
| Current Price | $291.02 | | | | | |
| Discount To Fair Value | | -28.35% | -5.52% | -0.21% | 7.17% | -2.29% |
| Upside To Fair Value | | -22.09% | -5.23% | -0.21% | 7.73% | -2.24% |
| 2021 EPS | 2022 EPS | 2021 Weighted EPS | 2022 Weighted EPS | 12-Month Forward EPS | 12-Month Average Fair Value Forward PE | Current Forward PE |
| $11.98 | $12.50 | $4.84 | $7.45 | $12.29 | 23.1 | 23.7 |
BRK has spent the last 18 months undervalued. But its incredible rally in 2021 has made BRK fairly valued.
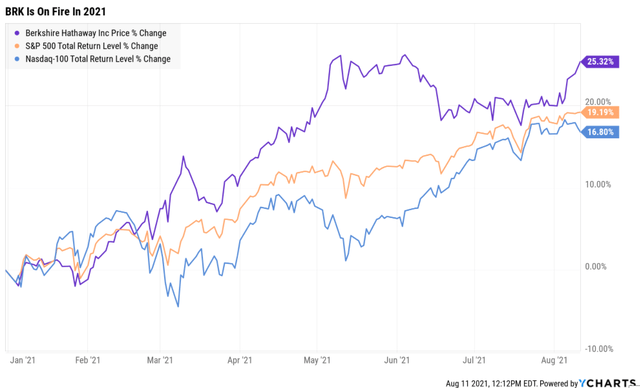
Mind you analysts are still super bullish on the stock.
| Analyst Median 12-Month Price Target | Morningstar Fair Value Estimate |
| $375.00 | $293.00 (DK estimate $285, 3% lower) |
| Discount To Price Target (Not A Fair Value Estimate) | Discount To Fair Value |
| 22.51% | 0.82% |
| Upside To Price Target | Upside To Fair Value |
| 29.04% | 0.83% |
Analysts are guessing that BRK will rally 29% in the next 12 months.
But guess who doesn't care about short-term price targets?
If you are not willing to own a stock for 10 years, do not even think about owning it for 10 minutes." -Warren Buffett
| Time Frame (Years) | Total Returns Explained By Fundamentals/Valuations |
| 1 Day | 0.02% |
| 1 month | 0.5% |
| 3 month | 1.5% |
| 6 months | 3% |
| 1 | 6% |
| 2 | 17% |
| 3 | 25% |
| 4 | 34% |
| 5 | 42% |
| 6 | 50% |
| 7 | 59% |
| 8 | 67% |
| 9 | 76% |
| 10 | 84% |
| 11+ | 90% to 91% |
(Sources: DK S&P 500 Valuation And Total Return Potential Tool, JPMorgan, Bank of America, Princeton, RIA)
Buffett knows disciplined financial science and that BRK at $375 by mid-2022 would represent about 28.5X forward earnings.
It's highly unlikely that BRK would keep buying back its stock at a 25% historical premium.
And that's why it makes so much sense for Buffett to buy Enbridge, lock, stock, and barrel.
Enbridge Market-Determined Fair Value
| Metric | Historical Fair Value Multiples (9-Years, 100% worst bear market in industry history) | 2020 | 2021 | 2022 | 2023 | 12-Month Forward Fair Value |
| 5-Year Average Yield | 6.17% | $41.33 | $43.16 | $43.16 | $46.68 | |
| Operating Cash Flow | 9.85 | $38.11 | $41.41 | $47.61 | $45.07 | |
| EBITDA | 8.18 | $33.94 | $45.22 | $49.38 | $50.26 | |
| EBIT (operating income) | 12.45 | $34.61 | $48.96 | $55.26 | $55.54 | |
| Average | | $36.77 | $44.52 | $48.47 | $49.07 | $46.87 |
| Current Price | $40.15 | | | | | |
| Discount To Fair Value | | -9.20% | 9.81% | 17.17% | 18.18% | 14.35% |
| Upside To Fair Value (NOT Including Dividends) | | -8.43% | 10.87% | 20.73% | 22.22% | 16.75% |
| 2021 OCF | 2022 OCF | 2021 Weighted OCF | 2022 Weighted OCF | 12-Month Forward OCF | 12-Month Average Fair Value Forward P/OCF | Current Forward P/OCF |
| 4.2 | 4.83 | $1.70 | $2.88 | $4.58 | 10.24 | 8.77 |
ENB is trading at 8.8X forward cash flow, a multiple so low that the Graham/Dodd fair value formula says it prices in just 0.2% CAGR long-term growth.
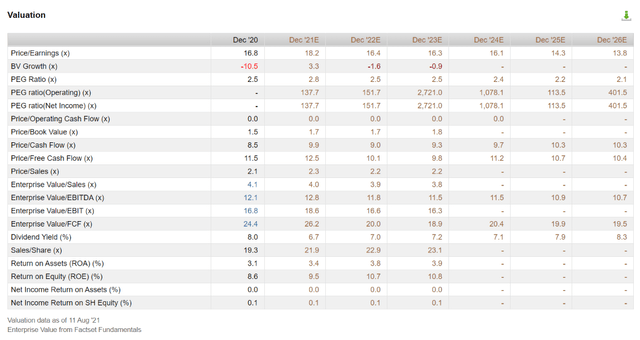
(Source: FactSet Research Terminal)
ENB is trading at 8.7X forward cash flow and 12.3X EV/EBITDA vs a 13-year median of 16.9.
These are private equity valuations for one of the highest quality companies on earth and a potential goldmine of future cash flow growth for Berkshire.
Now we get to the reason that Buffett is the only one who can buy Enbridge.
| ENB Premium BRK Might Pay | ENB Price | Market Cap (Billion) | BRK Remaining Investable Cash (Billion) |
| 0% | $46.87 | $94.19 | $27.91 |
| 5% | $49.34 | $98.90 | $23.20 |
| 10% | $52.08 | $103.60 | $18.50 |
Would ENB shareholders vote for a $47 to $52 buyout offer from Berkshire?
While I personally wouldn't vote "yes," a 30% premium from the current price might get the deal done.
And it would still leave Berkshire with $18.5 billion in cash, minus the $20 billion insurance reserve that Buffett considers essential to the company's financial health.
But what about ENB's debt?
ENB Balance Sheet Forecast Consensus
| Year | Total Debt (Millions) | Net Debt (Millions) | Interest Cost (Millions) | EBITDA (Millions) | Operating Income (Millions) | Interest Costs |
| 2020 | $52,650 | $52,294 | $2,198 | $10,446 | $7,525 | 4.17% |
| 2021 | $54,539 | $54,397 | $2,158 | $11,186 | $7,706 | 3.96% |
| 2022 | $53,819 | $53,538 | $2,282 | $12,179 | $8,621 | 4.24% |
| 2023 | $53,190 | $52,799 | $2,350 | $12,479 | $8,765 | 4.42% |
| 2024 | $54,908 | NA | $2,394 | $12,478 | NA | 4.36% |
| 2025 | $55,007 | NA | $2,512 | $13,141 | NA | 4.57% |
| 2026 | $55,383 | NA | $2,632 | $13,428 | NA | NA |
| Annualized Growth | 0.85% | 0.32% | 3.05% | 4.27% | 5.22% | 1.81% |
(Source: FactSet Research Terminal)
Indeed, BRK would have to take on that $55 billion in debt, making a potential ENB acquisition a $160 billion deal, and one of the largest acquisitions in history.
But remember that ENB's debt is very secure, and is self-funding.
ENB Leverage Consensus Forecast
| Year | Debt/EBITDA | Net Debt/EBITDA (5.0 Or Less Safe According To Rating Agencies) | Interest Coverage (2+ Safe) |
| 2020 | 5.04 | 5.01 | 3.42 |
| 2021 | 4.88 | 4.86 | 3.57 |
| 2022 | 4.42 | 4.40 | 3.78 |
| 2023 | 4.26 | 4.23 | 3.73 |
| 2024 | 4.40 | NA | NA |
| 2025 | 4.19 | NA | NA |
| 2026 | 4.12 | NA | NA |
| Annualized Change | -3.29% | -5.45% | 2.90% |
(Source: FactSet Research Terminal)
ENB is expected to steadily de-leverage even as it embarks on a $37 billion growth backlog.
ENB Dividend Forecast
| Year | Dividend Consensus | DCF/Share Consensus | Payout Ratio | Retained Cash Flow (After Dividends) | Buyback Potential | Debt Repayment Potential |
| 2021 | $2.66 | $3.90 | 68.2% | $2,512 | 3.10% | 4.6% |
| 2022 | $2.77 | $4.21 | 65.8% | $2,917 | 3.60% | 5.4% |
| 2023 | $2.88 | $4.27 | 67.4% | $2,816 | 3.48% | 5.3% |
| 2024 | $2.83 | $4.37 | 64.8% | $3,120 | 3.85% | 5.7% |
| 2025 | $3.15 | $4.68 | 67.3% | $3,100 | 3.83% | 5.6% |
| 2026 | $3.31 | $4.81 | 68.8% | NA | NA | NA |
| Total 2021 Through 2026 | $17.60 | $26.24 | 67.1% | $14,465.64 | 17.87% | 26.52% |
| Annualized Rate | 4.47% | 4.28% | 0.18% | 4.29% | 4.29% | 4.11% |
(Source: FactSet Research Terminal)
83% payout ratio is safe in this industry and ENB is expected to remain well under that. If BRK were to buy ENB, the dividend vanishes and BRK would get all of ENB's $44 billion in free cash flow through 2025.
Reason 3: Total Return Potential That's Better Than Berkshire's
For context, here's the return potential of the 29% overvalued S&P 500.
S&P 500 2023 Consensus Total Return Potential
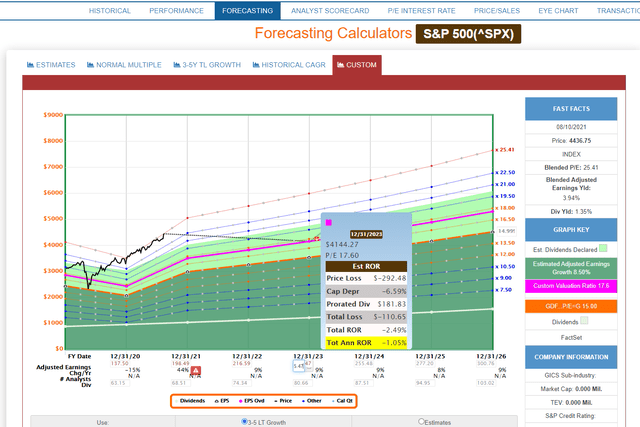
(Source: FAST Graphs, FactSet Research)
S&P 500 2026 Consensus Total Return Potential
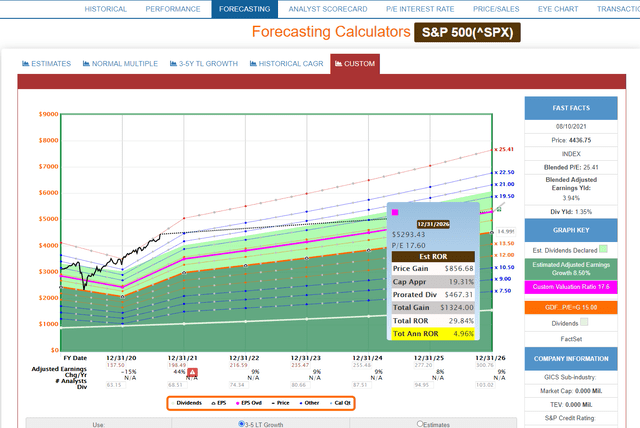 (Source: FAST Graphs, FactSet Research)
And here's what investors buying ENB today can reasonably expect.
- Five-year consensus return potential range: 12% to 22% CAGR
ENB 2023 Consensus Total Return Potential
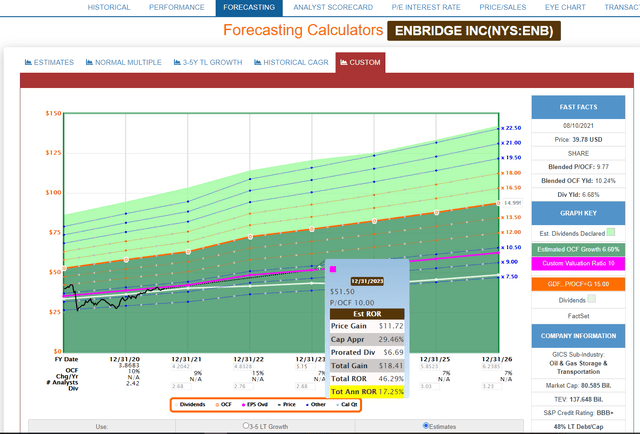
(Source: FAST Graphs, FactSet Research)
ENB 2026 Consensus Total Return Potential
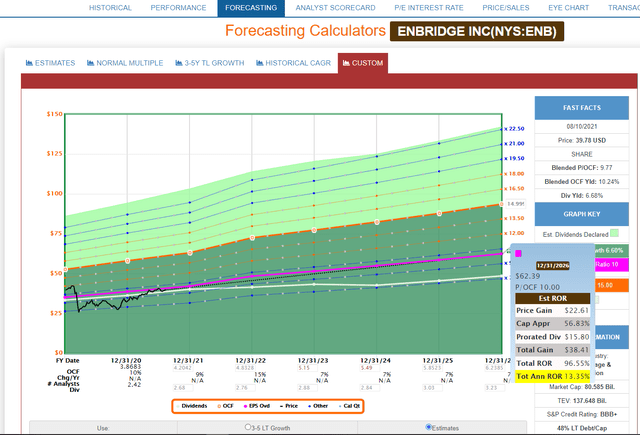
(Source: FAST Graphs, FactSet Research)
Now let's take a look at what BRK investors buying today, near fair value, can expect.
BRK 2023 Consensus Total Return Potential
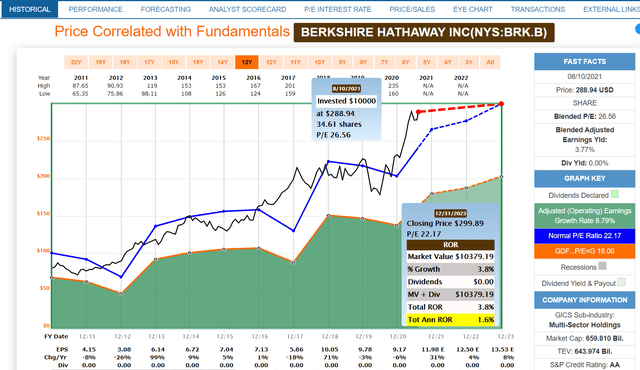
(Source: FAST Graphs, FactSet Research)
BRK 2026 Consensus Total Return Potential
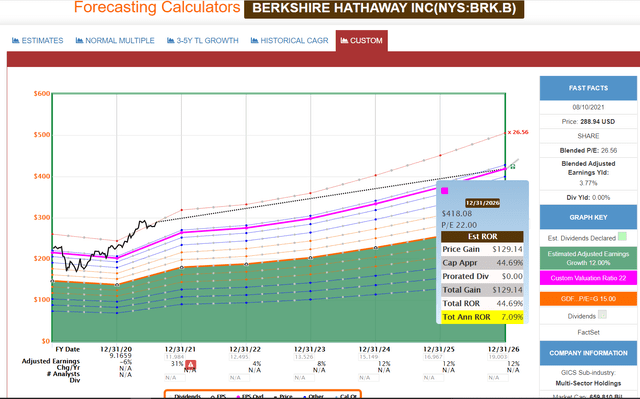
(Source: FAST Graphs, FactSet Research)
7% returns is better than what analysts expect from the market, but if BRK were to buy ENB and drive growth to the upper end of the analyst consensus range (15%) and trades at the upper end of historical fair value (23 PE).
What BRK Buying ENB Could Deliver
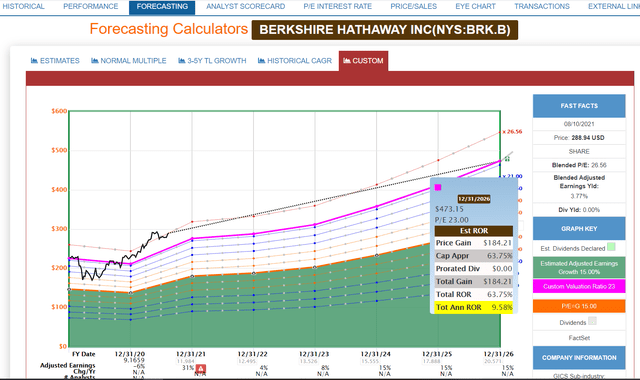
(Source: FAST Graphs, FactSet Research)
10% annual returns that double the market over the next five years and is 33% better than what BRK is expected to deliver without a major needle-moving acquisition.
Today analysts expect BRK to deliver about 12% CAGR long-term returns vs 9.9% for the S&P 500 and 11.2% for the aristocrats.
If BRK buys ENB then it could grow 2% to 3% faster over time, and deliver 14% to 15% CAGR total returns for many decades.
That's the ultimate bottom line for why Buffet should buy Enbridge rather than keep pouring $6 billion per quarter into BRK stock now that it's no longer undervalued.
BRK Investment Decision Score
| Ticker | brk-b | DK Quality Rating | 70% | | Investment Grade | B- |
| Sector | Finance | Safety | 5 | | Investment Score | 81% |
| Industry | Diversified Financial Services | Dependability | 64% | | 5-Year Dividend Return | 0.00% |
| Sub-Industry | Multi-Sector Holdings | Business Model | 3 | | Today's 5+ Year Risk-Adjusted Expected Return | 5.29% |
| Blue-Chip, Phoenix, Low Volatility |
| Goal | Scores | Scale | Interpretation |
| Valuation | 2 | hold | brk-b's -1.94% discount to fair value earns it a 1-of-4 score for valuation timeliness |
| Preservation of Capital | 7 | Excellent | brk-b's credit rating of AA implies a 0.51% chance of bankruptcy risk and earns it a 7-of-7 score for Preservation of Capital |
| Return of Capital | N/A | N/A | N/A |
| Return on Capital | 8 | Very Good | brk-b's 5.29% vs. the S&P's 3.50% 5-year risk-adjusted expected return (RAER) earns it an 8-of-10 Return on Capital score |
| Total Score | 17 | Max score of 21 | | | S&P's Score | |
| Investment Score | 81% | Well Above Market Average | | | 73/100 = C(Market Average) | |
| Investment Letter Grade | B- | | | | |
(Source: DK Automated Investment Decision Tool)
BRK today represents a decent long-term investment compared to the 29% overvalued S&P 500. But take a look at Enbridge.
ENB Investment Decision Score
| Ticker | enb | DK Quality Rating | 12 | 82% | Investment Grade | A |
| Sector | Energy | Safety | 5 | 84% | Investment Score | 97% |
| Industry | Oil, Gas & Consumable Fuels | Dependability | 4 | 83% | 5-Year Dividend Return | 42.33% |
| Sub-Industry | Oil & Gas Storage & Transportation | Business Model | 3 | | Today's 5+ Year Risk-Adjusted Expected Return | 9.51% |
| Ultra SWAN, Phoenix, Top Buy, Safe Midstream, Strong ESG |
| Goal | Scores | Scale | Interpretation |
| Valuation | 4 | Strong Buy | enb's 15.13% discount to fair value earns it a 4-of-4 score for valuation timeliness |
| Preservation of Capital | 6 | Above Average | enb's credit rating of BBB+ implies a 5% chance of bankruptcy risk and earns it a 6-of-7 score for Preservation of Capital |
| Return of Capital | 10 | Exceptional | enb's 42.33% vs. the S&P's 9.22% 5-year potential for return via dividends earns it a 10-of-10 Return of Capital score |
| Return on Capital | 10 | Exceptional | enb's 9.51% vs. the S&P's 3.52% 5-year risk-adjusted expected return (RAER) earns it a 10-of-10 Return on Capital score |
| Total Score | 30 | Max score of 31 | | | S&P's Score | |
| Investment Score | 97% | Excellent | | | 73/100 = C(Market Average) | |
| Investment Letter Grade | A | | | | |
(Source: DK Automated Investment Decision Tool)
ENB remains one of the most reasonable and prudent high-yield blue-chips you can buy in today's market.
Bottom Line: Enbridge Is An $80 Billion Blue-Chip That Both Buffett And You Should Consider Buying
Don't get me wrong, I don't want Buffett to buy Enbridge. Not when ENB offers the opportunity to generate life-changing income and long-term returns like this.
Even if Buffett offered me a 30% premium ($52) I'd vote "no."
ENB Vs S&P 500 Vs Aristocrats Inflation-Adjusted Long-Term Return Forecast: $1,000 Investment
| Time Frame (Years) | 7.9% LT Inflation-Adjusted Returns (S&P Consensus) | 9.2% Inflation-Adjusted Returns (Aristocrat consensus) | 11.3% Inflation-Adjusted ENB Consensus |
| 5 | $1,325.65 | $1,552.79 | $1,707.95 |
| 10 | $1,757.34 | $2,411.16 | $2,917.10 |
| 15 | $2,329.62 | $3,744.03 | $4,982.27 |
| 20 | $3,088.26 | $5,813.70 | $8,509.49 |
| 25 | $4,093.94 | $9,027.47 | $14,533.80 |
| 30 | $5,427.13 | $14,017.78 | $24,823.04 |
| 35 | $7,194.46 | $21,766.69 | $42,396.57 |
| 40 | $9,537.33 | $33,799.13 | $72,411.34 |
| 45 | $12,643.14 | $52,483.01 | $123,675.14 |
| 50 | $16,760.36 | $81,495.18 | $211,231.27 |
My $64,000 ENB investment could be worth $13.5 million, adjusted for inflation, in 50 years and be paying me $838,000 in very safe annual income.
That's my ENB retirement plan.
| Time Frame (Years) | Ratio S&P vs Aristocrat Consensus | Ratio S&P vs ENB Consensus |
| 5 | 1.17 | 1.29 |
| 10 | 1.37 | 1.66 |
| 15 | 1.61 | 2.14 |
| 20 | 1.88 | 2.76 |
| 25 | 2.21 | 3.55 |
| 30 | 2.58 | 4.57 |
| 35 | 3.03 | 5.89 |
| 40 | 3.54 | 7.59 |
| 45 | 4.15 | 9.78 |
| 50 | 4.86 | 12.60 |
This is a 12/12 Ultra SWAN global aristocrat that could potentially beat the S&P 500 by almost 13X over the next 50 years.
And with ENB's fortress balance sheet, and virtually unlimited growth potential courtesy of renewal energy, in which it's the industry leader, it's my favorite midstream of all.
However, I also own BRK as a core growth holding. And while I'm not rooting for a $90,000 to $100,000 cash out from Buffett, I could easily find wonderful ways to put that money work that would actually increase my annual income.
I'm hardly the first analyst to speculate about what giant Buffett might want to buy next. However, I hope it's clear that even in today's overvalued market there's always something amazing to buy if you know where to look.
Even for someone with Buffett's $144 billion cash pile, there are numerous potential targets for his elephant gun.
For regular investors like you or I? We never lack for wonderful blue-chip bargains no matter our goals, risk profiles, or time horizons.
Today ENB represents a 6.7% yielding Ultra SWAN dividend aristocrat and the green giant of midstream.
If the only midstream dividend aristocrat (and first likely dividend king) sounds appealing to you, then today is most certainly a wonderful time to add the growth king of midstream to your diversified and prudently risk-managed portfolio.