for "you know who" EIA reports sharp decline in drilled but uncompleted shale well count
By Jozef Lieskovsky and Matthew French on 9/8/2021

click to enlarge
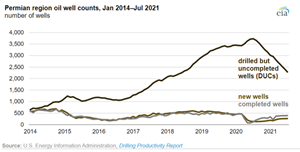
WASHINGTON - Based U.S. Energy Information Administration’s latest Drilling Productivity Report, 5,957 drilled but uncompleted wells (DUCs) were in the United States in all DPR regions in July 2021, the lowest for any month since November 2017. The decline in DUCs in most major U.S. onshore oil-producing regions, especially in the Permian region, reflects more well completions and, at the same time, less new well drilling activity. The completion of more wells is increasing oil production in the Permian region, but the completions are reducing the DUC inventories, which could limit oil production growth in the United States in the coming months.
The two main stages in bringing a horizontally drilled, hydraulically fractured well online are drilling and completion. The drilling phase involves dispatching a drilling rig and crew, who then drill one or more wells on a pad site. The next phase, well completion, is typically performed by a separate crew and involves casing, cementing, perforating, and hydraulically fracturing the well for production. In general, the time between the drilling and completion stages is several months, leading to a significant inventory of DUCs that producers can maintain as working inventory to manage oil production.

click to enlarge
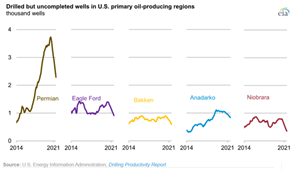
Of the five major U.S. oil-producing regions, DUCs in the Eagle Ford, Bakken, and Niobrara regions have declined to their lowest levels since December 2013, and DUCs in the Permian and Anadarko regions have declined to their lowest levels since June 2018. Although this significant reduction in DUCs follows an increasing rate of well completions in the Permian region, both the number of wells drilled and the number of wells completed in all other regions remain at historically low levels.
Indicators of new well drilling in the United States remain subdued. As of September 3, the Baker Hughes active oil rig count was 394 rigs. Although that figure is up 181 rigs from last year, the number is historically low compared with other periods when crude oil futures prices were near similar levels (or at even lower prices). Rising rig counts typically lag four to six months behind a crude oil price increase. If drilling activity doesn’t increase, then well completions and production may be limited because the inventory of DUCs continues to fall.