Where are we in the precious metals cycle?
There is no shortage of questions on why gold has significantly underperformed during such an ideal macro setting.
Let’s start by looking at the usual fundamental trends of this industry as part of prior historical cycles.
Gold and silver stocks have never peaked at historically undervalued levels. Miners are now trading at the cheapest fundamental multiples we have ever seen.
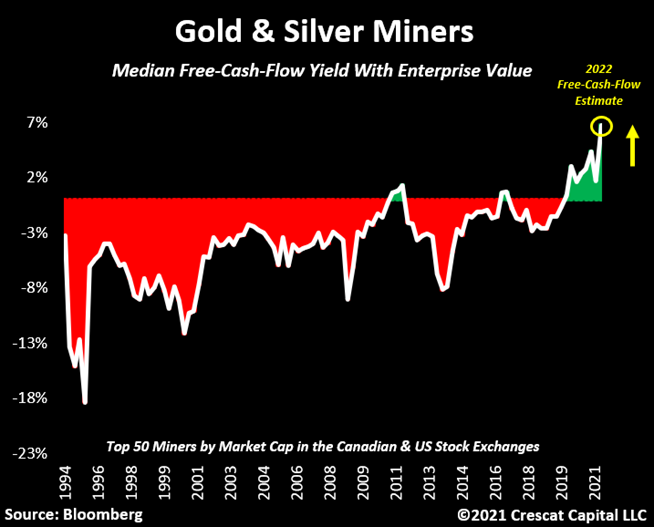
Assuming the current 2022 free-cash-flow estimate relative to the current enterprise value, the median company among the 50 largest miners in the US and Canada exchange now trades at an unprecedented 7% yield.
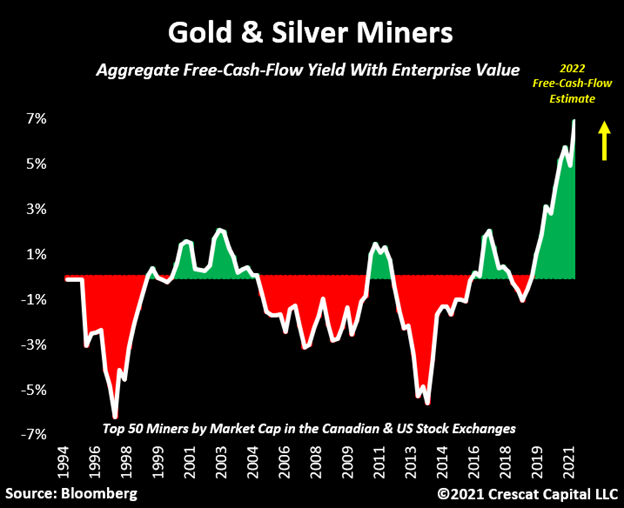
Note that in aggregate terms, the same basket of companies also trades at its highest free-cash-flow yield in history.
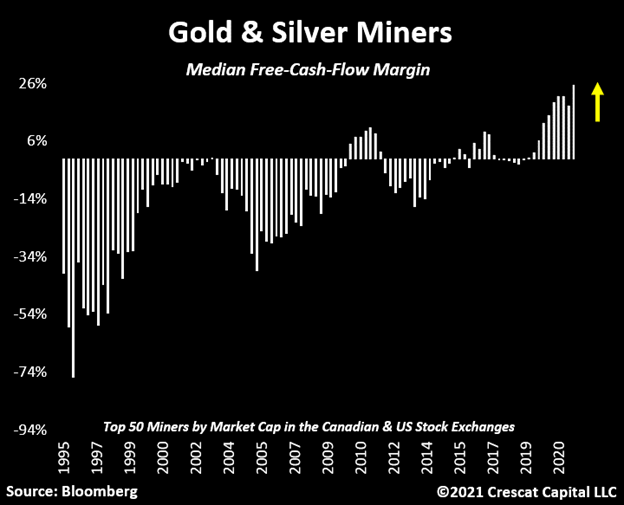
Additionally, as shown in the second panel of the chart below, gold and silver miners continue to expand their margins in a significant way. The median free-cash-flow margin is now above 25%.
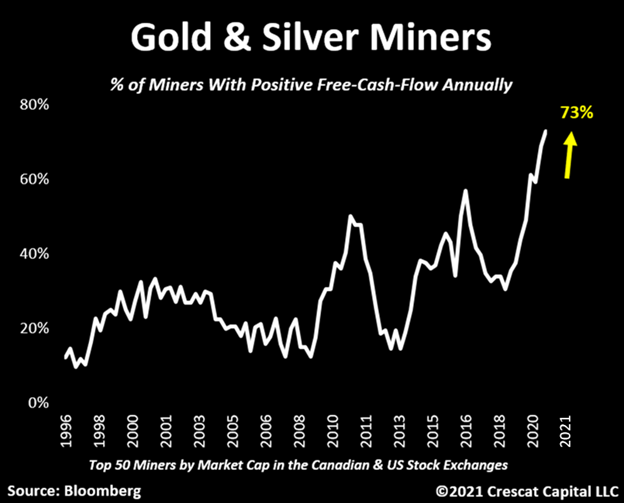
Believe it or not, today, 73% of the top 50 gold and silver miners are profitable on a free cash flow basis. That is the highest level we have ever seen.
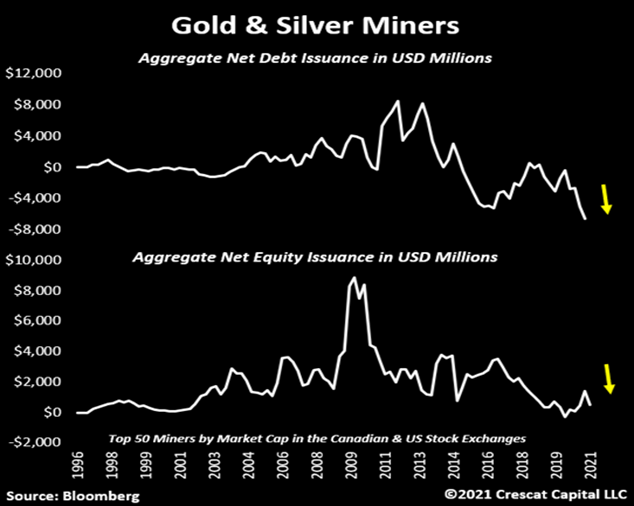
Historically, mining companies tend to lever up and dilute massive amounts of shares when they are at the top of their cycle.
We are experiencing the complete opposite today.
These companies have become true free-cash-flow machines and are now able to not only pay down debt but to avoid significant equity issuances to finance their businesses.
In fact, gold and silver miners just repaid the largest amount of debt in the last 25 years.
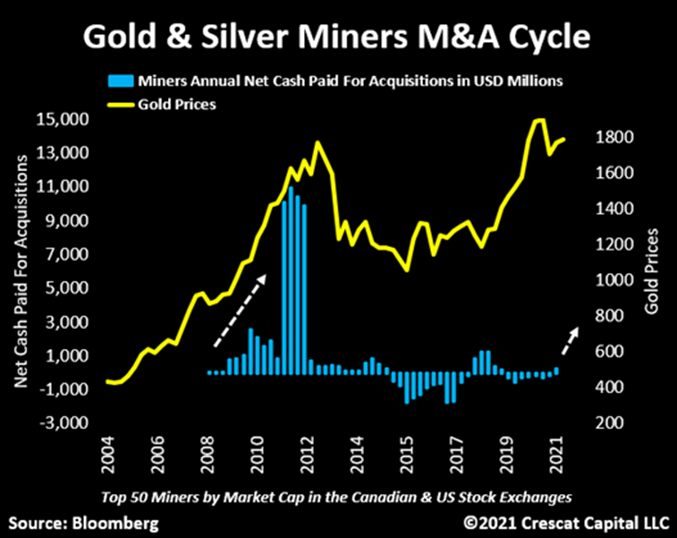
We have not even seen the onset of an M&A cycle yet. PM miners have turned gun-shy when it comes to acquiring new projects or companies.
Remember, mining companies tend to overpay for deals at the peak of the cycle. We are barely seeing any deals being done today.
It is quite normal for gold to struggle after making new highs. We have seen this price behavior happen twice before.
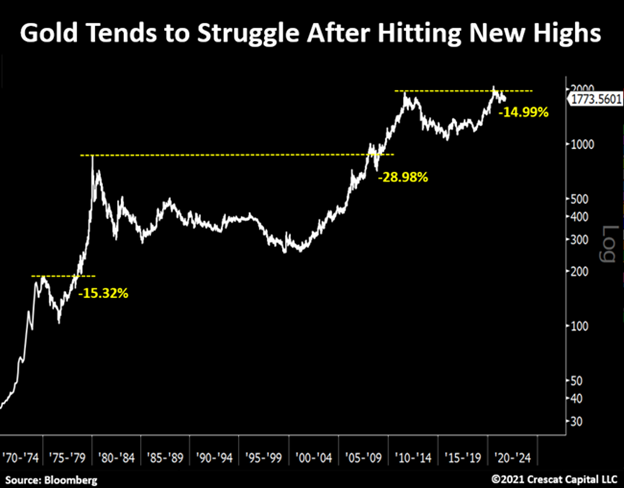
In March 1978, gold briefly reached a record level and then corrected by 15% soon after.
Also, January 2008, the metal hit new highs and continued to appreciate for another month until declining by 28% during the GFC.
We are probably seeing a similar issue today again. The price is now 14% lower, and the entire financial media already claims that gold is dead.
Note, however, how the shiny metal tends to come screaming back after these pullbacks.
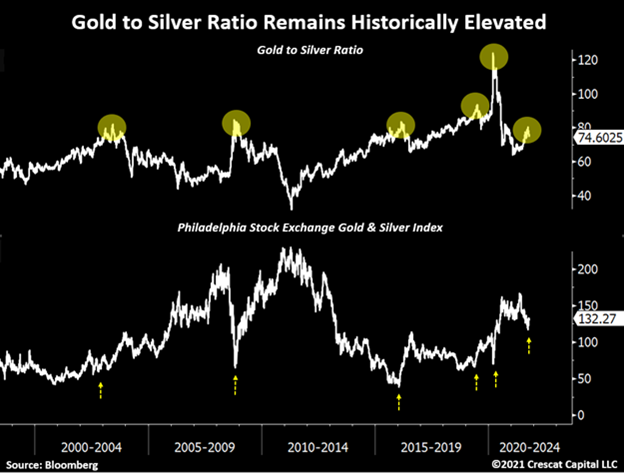
The gold to silver ratio usually reaches historical lows when miners are near peak cycle.
Yes, this ratio was higher during the covid crisis, but the current levels are almost as low as it was during other major bottoms.
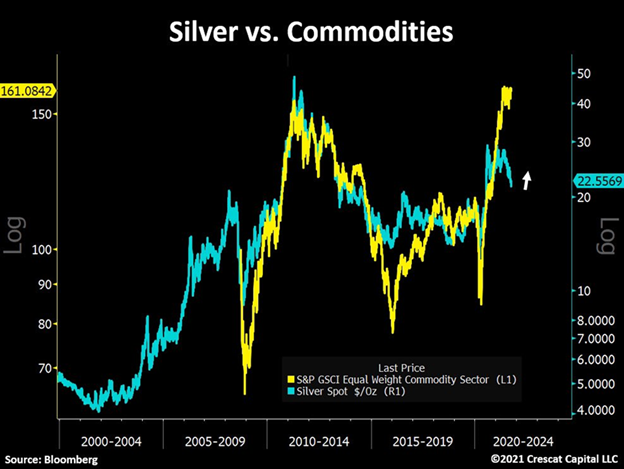
We think silver is the cheapest metal on earth.
Here are some technical reasons to be long precious metals:
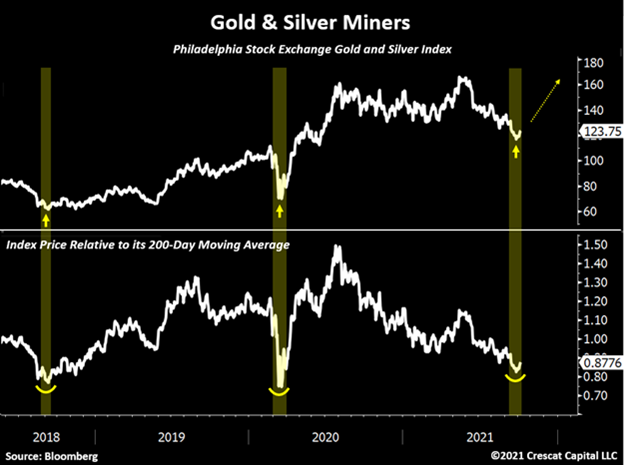
Miners still look very oversold. Last times we had such a divergence between the Philadelphia Gold and Silver index relative to its 200 day moving average, it also marked two important bottoms.
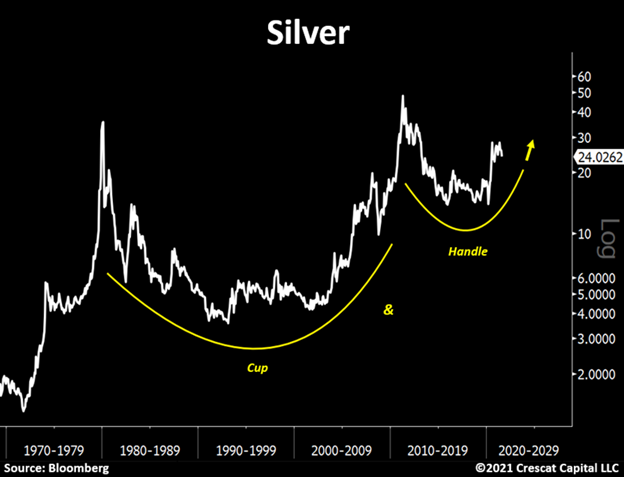
Silver remains historically undervalued relative to money supply and is now technically forming a double bottom.
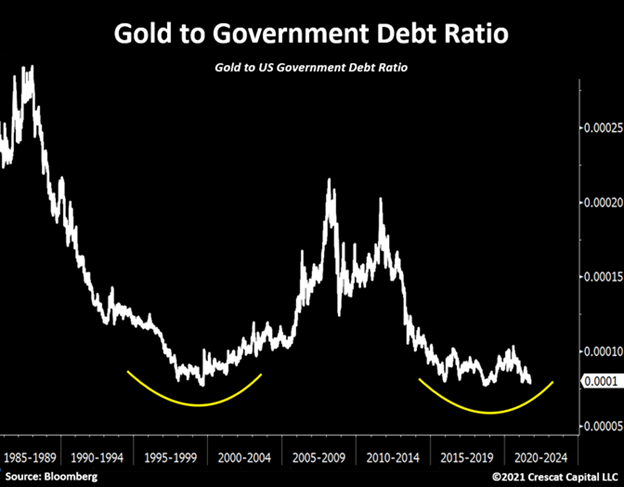
Interestingly, as the government has continued to pile on more and more debt, gold has underperformed. Such a phenomenon is unsustainable in our view.
Today, the setup today looks just like it did in the early 2000s ahead 10-year precious metals bull market.
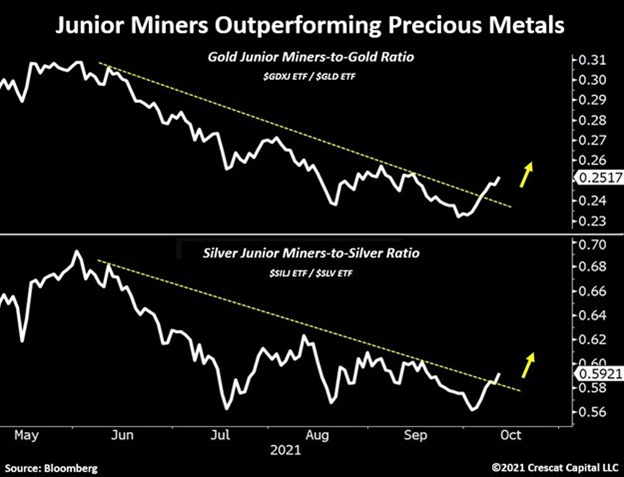
Junior miners in the PM industry have started to outperform the seniors. These are important signs that a bottoming is taking place.
Ideally, one wants to see the risker parts of the market not only holding up their values but perhaps even leading the way to the upside.
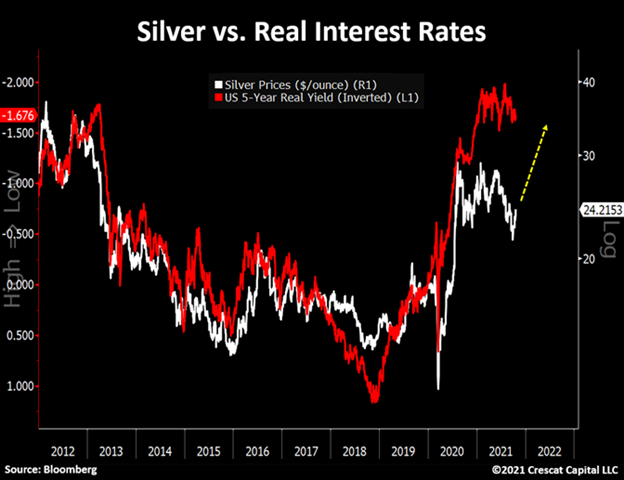
The correlation between inverted real interest rates and precious metals is strong and indicates that the industry is due for a jump. Here is silver vs. 5-year TIPS yield:
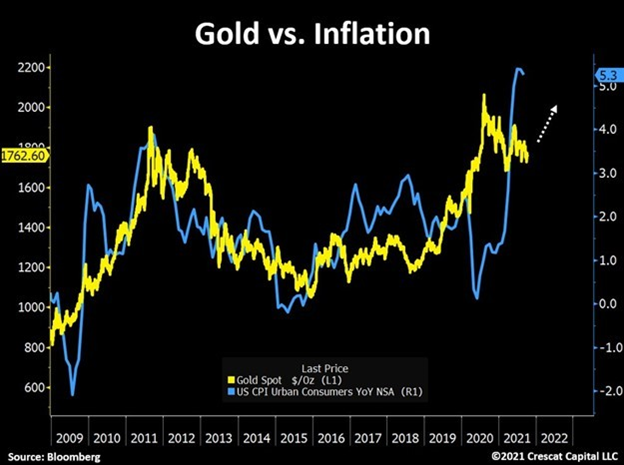
As inflation continues to develop in the economy, see below the incredible link between gold and CPI since the GFC.
Note how after the pandemic lows, gold front ran the potential risk of a rise in consumer prices and the entire precious metals market appreciated sharply.
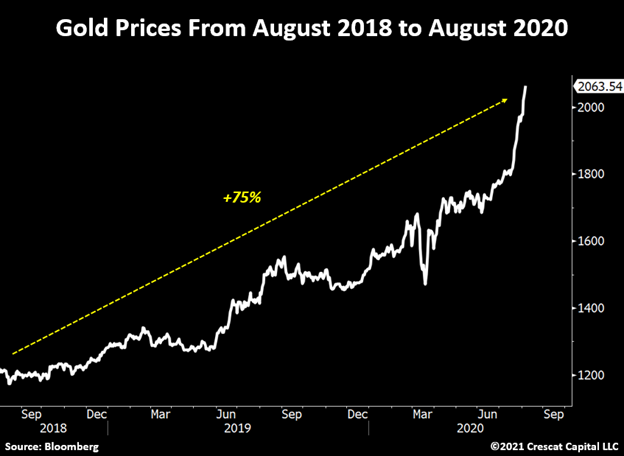
It is important to remember that before recently peaking, gold had been going on a streak for two years already.
The metal was up more than 75% from August 2018 to August 2020 and even reached historical highs during this period.
Back then, with CPI around 1%, very few investors foresaw inflation as a risk to the economy. Now it is a real problem.
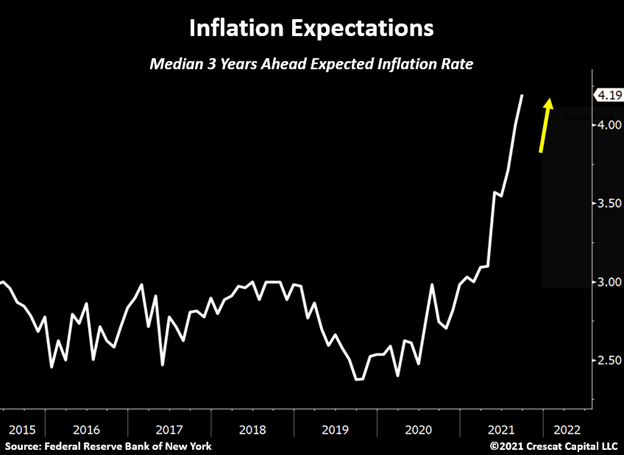
We think gold likely appreciated too quick and too fast becoming what some thought as an obvious trade.
Extreme sentiment probably explains the reason for its recent weakness after signaling way earlier than any other asset the possibility that an inflationary environment could be ahead of us.
We are now on the other side of this extreme.
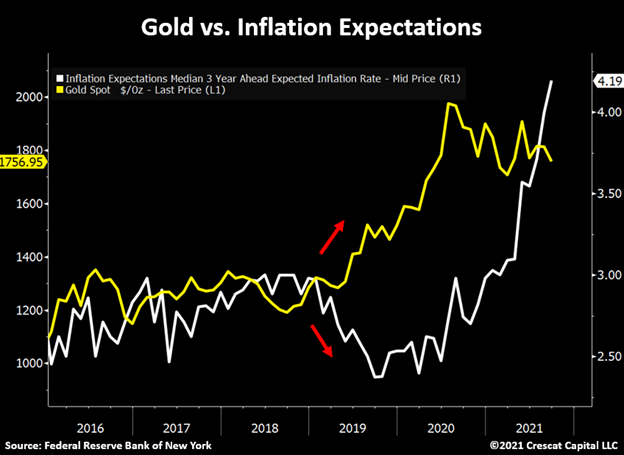
Gold looks fundamentally cheap, technically oversold while inflation continues to gain traction. See below global central bank assets reaching new highs while gold is still lagging. For us, it’s a matter of time until gold follows to the upside.
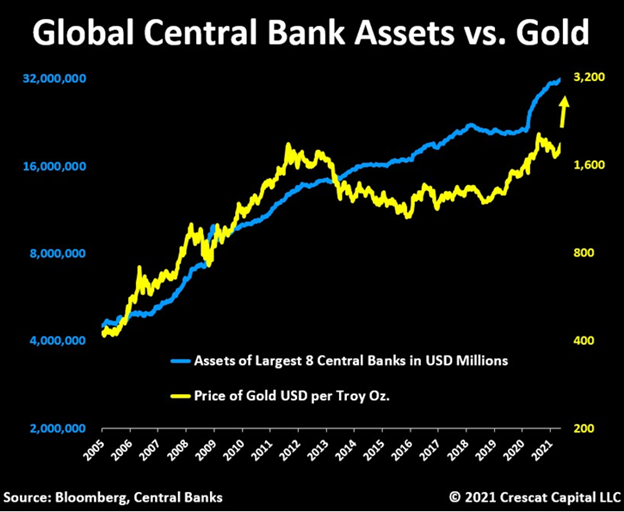
We also believe that the historic relationship between PMs and the growth in CPI will continue to be strong and the recent pullback in gold and silver related assets poses an incredible opportunity for investors to deploy capital at what we believe to be truly attractive levels.
Keep in mind that we are using government reported numbers to gauge inflation in this analysis.
We should all know by now that the true cost of goods and services is growing at a drastically faster pace than CPI.
Let’s do some comparable analysis now:
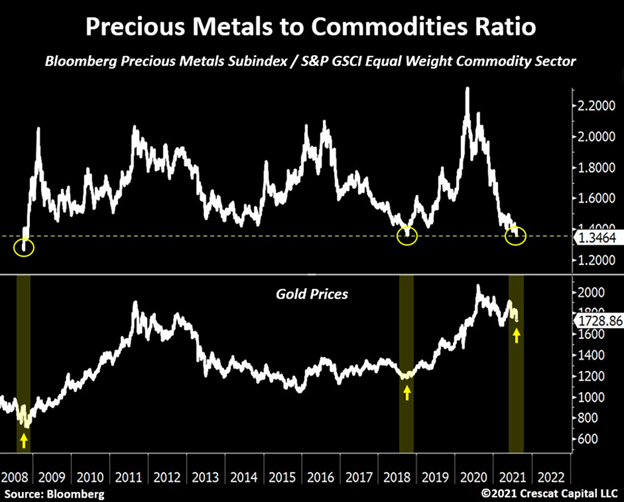
Precious metals are now at their cheapest levels relative to other commodities since 2009. The other 2 times this ratio reached such depressed levels also marked incredible buying opportunities.
Silver has some major catch up to do. Overall commodities are leading the way and look ready for another big move to the upside after consolidating.
Back to fundamentals:
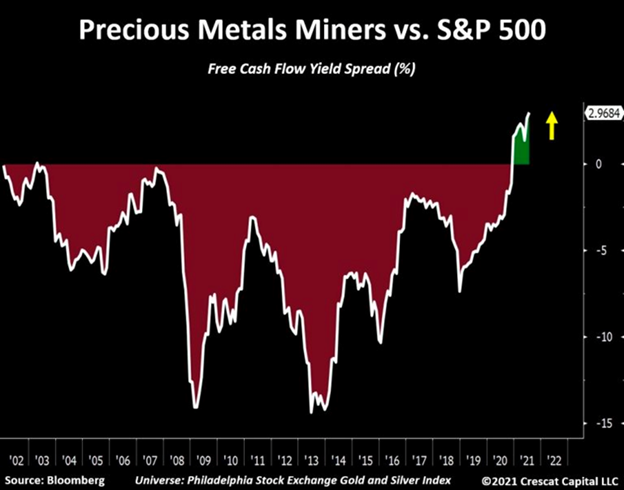
Gold and silver miners have never looked this cheap relative to the S&P 500. Their free-cash-flow yield is almost twice the overall market. The value and growth proposition embedded in miners today is unmatched by any other time in history.
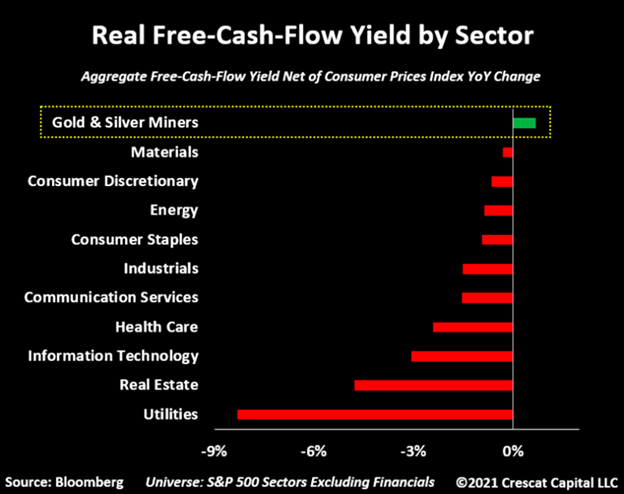
If gold and silver miners were considered a sector, it would be the only part of the economy today that generates higher free-cash-flow yield than inflation.
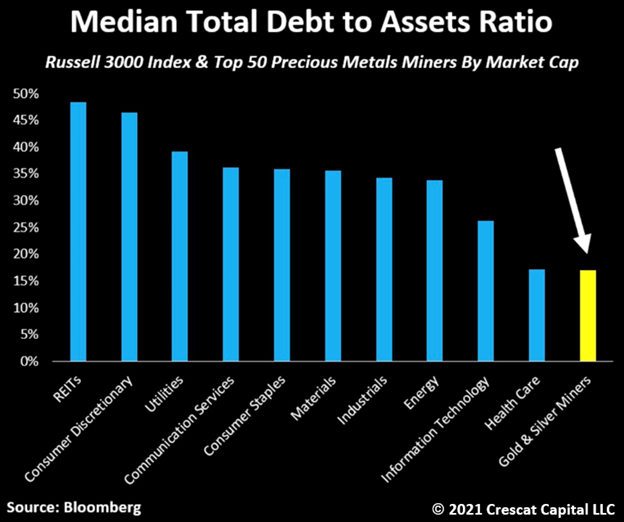
Again, if precious metals stocks were a sector, they would have the cleanest balance sheets of them all.
Consider the fact that the mining industry is also a very capital intensive business.
On the supply side:
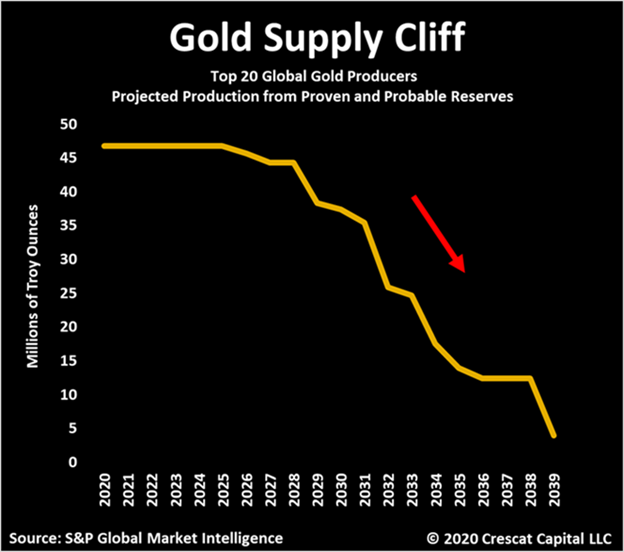
Because of a decade of exploration underinvestment, there have been no major new gold discoveries in the last four years.
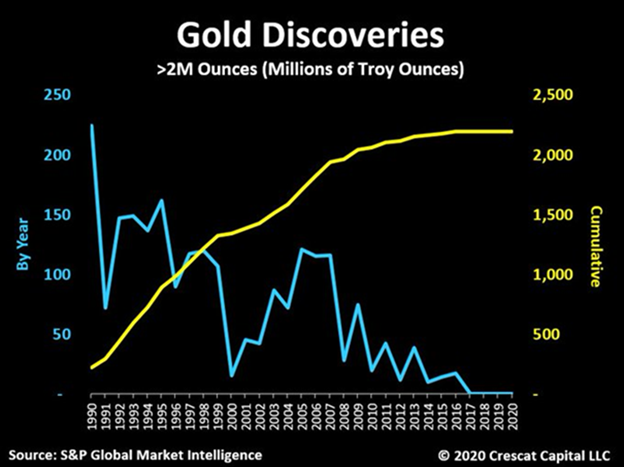
More importantly, the majors have not been replacing their reserves and the industry is about to face a supply cliff.
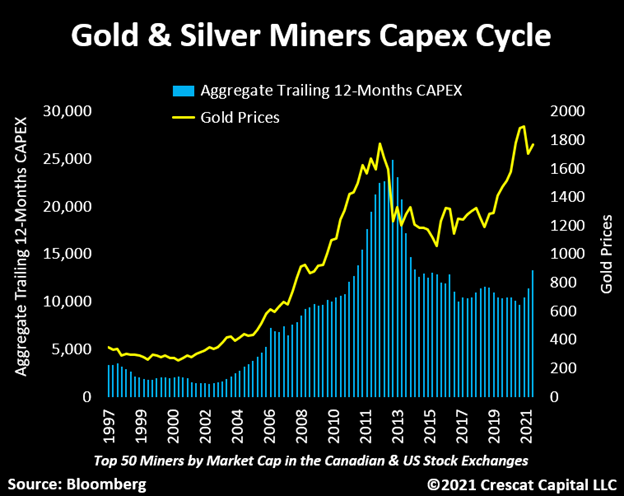
Miners have been reluctant to spend capital even though gold prices have been moving higher.
Thus, supply is constrained, an incredibly bullish fundamental backdrop for gold and silver.
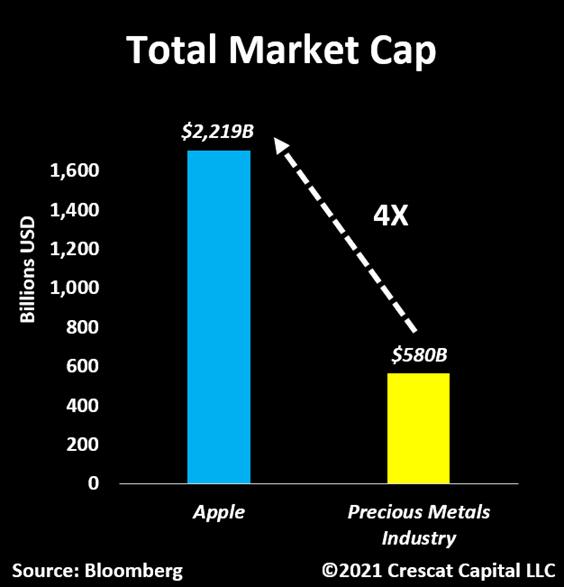
Finally, a great reminder of asymmetry:
The entire precious metals industry is dirt cheap. Apple’s market cap is 4 times the size of the whole precious metals industry.
Inevitably, secular trends and long-term investment theses are always being tested.
It is our job to identify the times when price volatility becomes unwarranted and use it as an opportunity to allocate capital accordingly.
We think this is the case today.
Our deep understanding of the mining industry along with our comprehensive macro and value framework gives us enormous conviction to stick with our strategy and continue to be buyers of these assets at lower prices.
To be clear, we did not make a firmwide commitment to partner with arguably the most successful exploration geologist to launch a precious metals fund if all we were aiming for was a couple years of strong returns.
Gold and silver cycles are long-term trends that tend to last many years.
Our view is that if there was ever a time to go up on the risk curve in exchange for upside return potential, that time is now.
The market is pricing PM companies at dirt cheap multiples as if they will be going out of business in the next couple of years.
In our humble our opinion, that could not be further from the truth.
https://www.crescat.net/october-research-letter/
Download PDF Version
Sincerely,
Kevin C. Smith, CFA
Member & Chief Investment Officer
Tavi Costa
Member & Portfolio Manager
For more information including how to invest, please contact:
Marek Iwahashi
Client Service Associate
miwahashi@crescat.net
303-271-9997
Cassie Fischer
Client Service Associate
cfischer@crescat.net
(303) 350-4000
Linda Carleu Smith, CPA
Member & COO
lsmith@crescat.net
(303) 228-7371
© 2021 Crescat Capital LLC
Important Disclosures
Performance data represents past performance, and past performance does not guarantee future results. An individual investor’s results may vary due to the timing of capital transactions. Performance for all strategies is expressed in U.S. dollars. Cash returns are included in the total account and are not detailed separately. Investment results shown are for taxable and tax-exempt clients and include the reinvestment of dividends, interest, capital gains, and other earnings. Any possible tax liabilities incurred by the taxable accounts have not been reflected in the net performance. Performance is compared to an index, however, the volatility of an index varies greatly and investments cannot be made directly in an index. Market conditions vary from year to year and can result in a decline in market value due to material market or economic conditions. There should be no expectation that any strategy will be profitable or provide a specified return. Case studies are included for informational purposes only and are provided as a general overview of our general investment process, and not as indicative of any investment experience. There is no guarantee that the case studies discussed here are completely representative of our strategies or of the entirety of our investments, and we reserve the right to use or modify some or all of the methodologies mentioned herein.
Separately Managed Account (SMA) disclosures: The Crescat Large Cap Composite and Crescat Precious Metals Composite include all accounts that are managed according to those respective strategies over which the manager has full discretion. SMA composite performance results are time weighted net of all investment management fees and trading costs including commissions and non-recoverable withholding taxes. Investment management fees are described in Crescat’s Form ADV 2A. The manager for the Crescat Large Cap strategy invests predominatly in equities of the top 1,000 U.S. listed stocks weighted by market capitalization. The manager for the Crescat Precious Metals strategy invests predominantly in a global all-cap universe of precious metals mining stocks.
Hedge Fund disclosures: Only accredited investors and qualified clients will be admitted as limited partners to a Crescat hedge fund. For natural persons, investors must meet SEC requirements including minimum annual income or net worth thresholds. Crescat’s hedge funds are being offered in reliance on an exemption from the registration requirements of the Securities Act of 1933 and are not required to comply with specific disclosure requirements that apply to registration under the Securities Act. The SEC has not passed upon the merits of or given its approval to Crescat’s hedge funds, the terms of the offering, or the accuracy or completeness of any offering materials. A registration statement has not been filed for any Crescat hedge fund with the SEC. Limited partner interests in the Crescat hedge funds are subject to legal restrictions on transfer and resale. Investors should not assume they will be able to resell their securities. Investing in securities involves risk. Investors should be able to bear the loss of their investment. Investments in Crescat’s hedge funds are not subject to the protections of the Investment Company Act of 1940. Performance data is subject to revision following each monthly reconciliation and annual audit. Current performance may be lower or higher than the performance data presented. The performance of Crescat’s hedge funds may not be directly comparable to the performance of other private or registered funds. Hedge funds may involve complex tax strategies and there may be delays in distribution tax information to investors.
Investors may obtain the most current performance data, private offering memoranda for a Crescat’s hedge funds, and information on Crescat’s SMA strategies, including Form ADV Part II, by contacting Linda Smith at (303) 271-9997 or by sending a request via email to lsmith@crescat.net. See the private offering memorandum for each Crescat hedge fund for complete information and risk factors.