Recently, I wrote an article about silver prices during the great depression, and given the fundamental backdrop in the economy, I thought it would be appropriate to explore gold prices during the Great Depression as well.
I am a firm believer that history tends to rhyme, albeit not always perfectly. Although there’s still a chance we could pull back from the brink, with each passing day, it appears that we are living in, or about to begin living in, something similar to the Great Depression. Therefore, although it appears that gold is a no-brainer investment in this environment, it can be helpful to understand how gold performed in the last depression, to understand how it could perform during what may turn out to be the next depression.
Before we start, it is important to know that gold prices during the 1920s and 1930s were fixed by the government. Therefore, it is difficult to glean as much valuable information from gold prices as we could have if the gold market was a free market during this time period. But we will examine the gold price history during this time period nonetheless.
Historical Charts
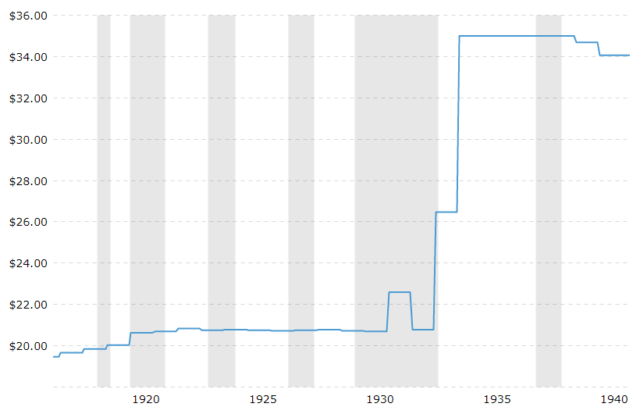
For historical gold prices, we turn to a chart from Macrotrends. This first chart is a little misleading, as it is adjusted for inflation, causing the numbers to be inflated, of course. However, since the gold price was fixed during the period of the 1920s and the Great Depression, the regular chart doesn’t show very much price movement (see that chart two charts below). Also, for your information, the grey shaded areas on the charts represent recessionary periods.
Gold Price Adjusted For Inflation
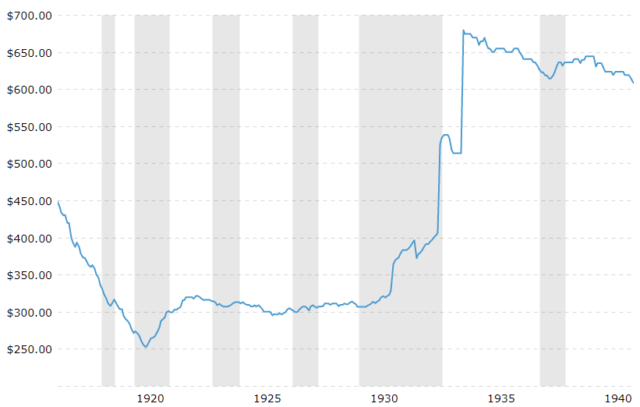
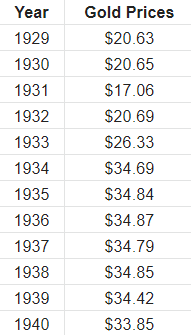
As you can see, the 1920s were relatively calm, followed by a period of deflation (The Great Depression) accompanied by the government raising the price fix from $20.69/oz to $34.69/oz, causing the inflation-adjusted value to go through the roof. I’m not sure we can draw a correlation between gold prices then and now, but take from it what you will.
