RE:RE:RE:RE:Anyone know why...JD, I think you would have to look at netback
CJ netback in Q1-22 was $50.47
Baytex netback in Q1-22 was $54.91 (with tough hedges) I'm not sure what the CJ netback is at $70....
Q1 Average WTI was $95.
This is why it is critical in a down trend for investors to know the numbers.
I can't speak to how good EN charts are...but what are companies making "net" is very important
JohnnyDoe wrote: BayStreetWolfTO wrote: Scienceguy, I agree you need to determine your metrics. Since you mentioned CJ yes right now they are in good shape but you need to understand the downside in all names
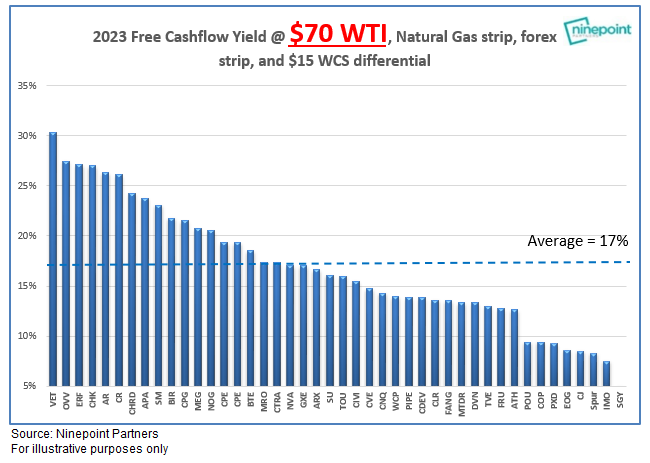
For instance CJ is looking good now but with a drop to $70 not my first pick.If you are confident $90+ it is a good hold
This chart helps detail the downside risk in $70 oil
Again is confident oil will be $90+ it could change your views

I wonder about the validity of these charts from Nuttall. CJ just produced 22k/day in Q2. At 70 wti, that is 562m in annualized revenue. At 8% fcf, that's not enough fcf to pay CJ's dividend. CJ says their current dividend is safe at 55. CJ's declaration about the safety of their dividend and that chart don't tell the same story.