Join today and have your say! It’s FREE!

Become a member today, It's free!

We will not release or resell your information to third parties without your permission.
Please Try Again
{{ error }}
By providing my email, I consent to receiving investment related electronic messages from Stockhouse.

or

Sign In

Please Try Again
{{ error }}
Password Hint : {{passwordHint}}
Forgot Password?

or

Please Try Again {{ error }}

Send my password

SUCCESS
An email was sent with password retrieval instructions. Please go to the link in the email message to retrieve your password.

Become a member today, It's free!

We will not release or resell your information to third parties without your permission.
Quote  |  Bullboard  |  News  |  Opinion  |  Profile  |  Peers  |  Filings  |  Financials  |  Options  |  Price History  |  Ratios  |  Ownership  |  Insiders  |  Valuation

Tamarack Valley Energy Ltd T.TVE

Alternate Symbol(s):  TNEYF

Tamarack Valley Energy Ltd. is a Canada-based oil and gas exploration and production company. The Company's asset portfolio is comprised of oil plays in Alberta, including Charlie Lake, Clearwater and several enhanced oil recovery (EOR) opportunities. The Company has an inventory of low-risk, oil development drilling locations. Its Clearwater oil play is located in north-central Alberta. Its Charlie Lake oil play is located in northwestern Alberta. Its EOR portfolio includes a set of assets across Alberta representing a range of formations and production types. The Company’s subsidiary is Tamarack Ridge Resources Inc.


TSX:TVE - Post by User

Post by smallcaptdron Nov 21, 2022 12:02pm
150 Views
Post# 35115612

Double Bottom @ $75 for Oil could be bullish

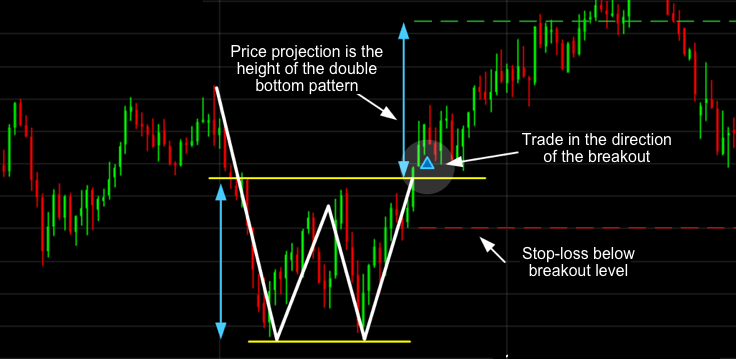
Double Bottom @ $75 for Oil could be bullishOil has now created a double bottom at $75 and usually, the next trend should be bullish heading higher but I worry about tomorrow's API Oil Stock numbers which are released after the markets close, and if API comes in with a higher number from -5.83 that could be bearish for Oil so Wed will be a really interesting day with all the US Data being released so just be prepared for volatility and if Oil survives and starts to head higher then today is a perfect time to buy cheaper shares.

A double bottom looks similar to the letter W and indicates when the price has made two unsuccessful attempts at breaking through the support level. It is a reversal chart pattern as it highlights a trend reversal. After unsuccessfully breaking through the support twice, the market price shifts towards an uptrend.
<< Previous
Bullboard Posts
Next >>