
peshkov
Note to readers: We recently changed our name from HFI Research MLPs to HFI Research Energy Income. From the beginning, we’ve been focused on midstream energy equities regardless of their corporate structure, and our new name better reflects that focus. We will also be extending our coverage of energy income equities and bonds into the upstream, downstream, and oilfield services sub-sectors.
Oil prices have plunged by more than 40% from their 2022 highs, causing doubt among many investors in the oil market bull thesis. To prevent the lousy price action from distracting oil equity investors from the still bullish long-term setup, it’s worthwhile to revisit some of the major premises that underpin the oil bull thesis.
Despite short-term concerns over an emerging contango in oil futures contracts and deteriorating refining margins—which will exert downward pressure on oil prices in the near term—the evidence continues to show that as long as prices are supportive, oil demand is likely to climb steadily higher for a least the next decade, and probably well beyond.
However, for demand to grow, oil prices must be low enough to incentivize increasing consumption. Low prices, meanwhile, will depend on having readily available supply. If supply becomes constrained, prices will rise to force demand lower.
We see a future in which oil supply is constrained for years, necessitating higher prices and lower demand than would be possible during the oil market of the past decade, when supply was abundant. The bull case for oil rests on the constrained supply outlook, which will be evident in a supply deficit that surfaces whenever prices are low and the quantity of oil demanded by consumers ticks above the level of available supply.
Putting Recent Oil Price Declines in Perspective
The ongoing crude price decline reflects a tug-of-war underway between bullish structural factors and bearish temporary factors.
The bullish factors include a sustained decline in global inventories, dwindling spare production capacity, slowing U.S. shale growth, and the outperformance of oil-related equities. The first three fundamental factors are now structural features of the oil market. As such, they will support a bullish supply and demand backdrop for years.
At the moment, however, they are being offset by temporary bearish factors, namely, strategic petroleum reserve releases, Chinese oil demand weakness, Russian oil supply strength. These temporary negatives are set to diminish in 2023, at which point the bullish structural factors will reassert themselves. As they do, we believe oil prices are likely to be sustained above $100 per barrel until the world can find a practical solution to the structural oil undersupply.
Bull Premise #1: Global Oil Inventories Are Declining
Oil inventories decline for one reason: demand exceeds supply. Global oil inventories have continued on a downtrend that has been in effect since 2020, when Covid-related travel restrictions caused demand to plunge and inventories to surge.
The trend can be seen in the oil inventories of the nations that belong to the Organization of Economic Cooperation and Development (OECD), which comprise the majority of global crude oil inventories. Aside from China, which builds and draws inventories for both strategic and economic reasons, nations outside the OECD have limited storage infrastructure and consume oil on a hand-to-mouth basis.
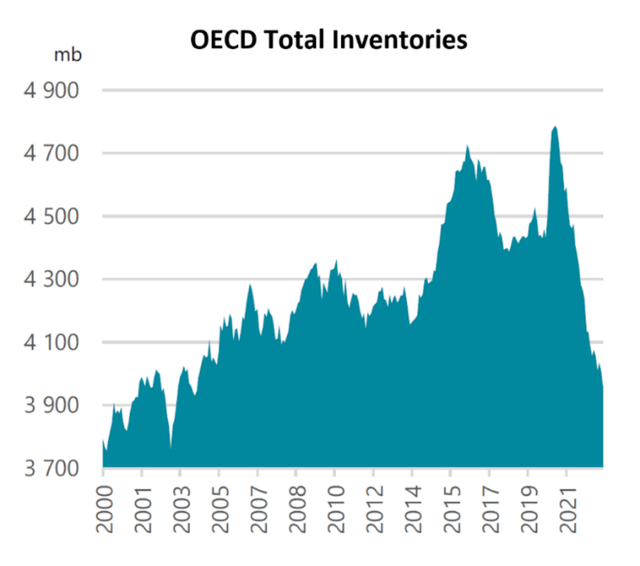
The following chart from the International Energy Agency’s (IEA) most recent Oil Market Report shows that OECD total inventories have fallen to their lowest level since 2004, when global oil demand was 17.6% below today’s level.
IEA
Source: International Energy Agency, Oil Market Report, Nov. 15. 2022, pg. 34.
The global inventory trend is evident in the U.S. inventory data published by the Energy Information Administration, arguably the highest-quality oil market data in the world. Oil trades in a global market, so regional supply imbalances are corrected via price differences. Over time, regional trends tend to reflect global trends, so U.S. inventory changes can serve as a reliable proxy for longer-term global trends.
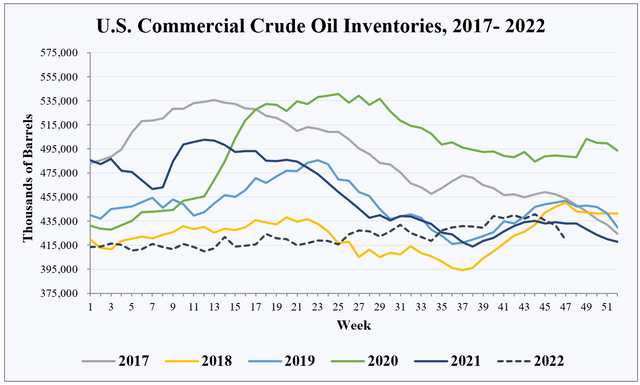
As with most oil-market analysis, even the highest-quality data have to be put in proper context. If we confine our analysis to U.S. commercial crude inventories alone, the situation doesn’t look too bad. It shows that U.S. inventories have flatlined throughout 2022, which implies the market is reasonably well balanced between supply and demand. While it is concerning that inventories sit at multi-year lows, this fact alone is not necessarily a cause for alarm.
EIA, HFI Research
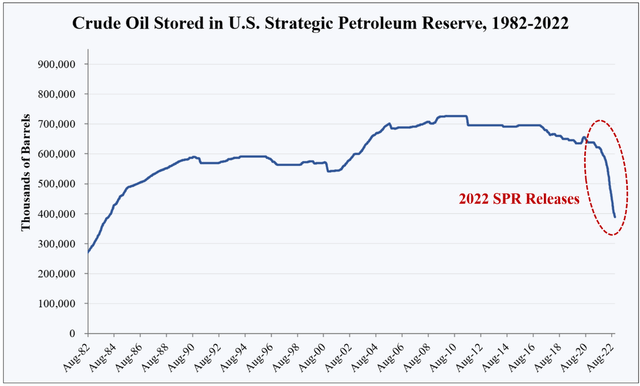
However, this picture leaves out the historic drawdown in the U.S. strategic petroleum reserve (SPR) inventories that began in May. SPR volumes have been released from storage caverns around the U.S. Gulf Coast into commercial inventories at a rate of 1 million barrels per day (bpd), an enormous quantity in today’s 100 million bpd global market in which the U.S. consumes 20.5 million bpd.
EIA, HFI Research
When SPR barrels are included, the domestic inventory picture becomes far more concerning. So far this year, the SPR has released 203 million barrels of crude into commercial inventories. This is the amount of oil required to keep commercial inventories flat and prevent a sharp drawdown that sends prices shooting higher.
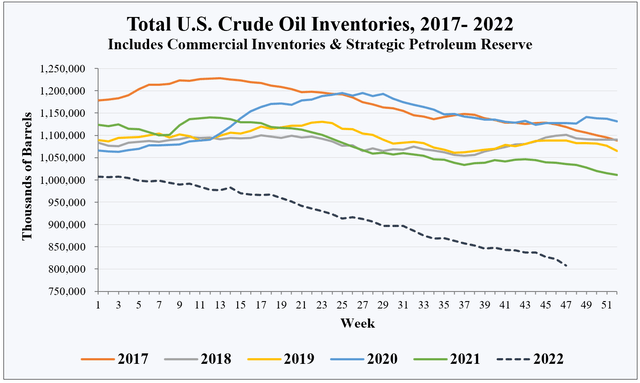
The following chart shows weekly changes in total U.S. inventories by year since 2017. It combines the oil stored in commercial inventories with the oil held in the strategic petroleum reserve. The decline that has occurred in 2022 relative to previous years is clear to see.
EIA, HFI Research
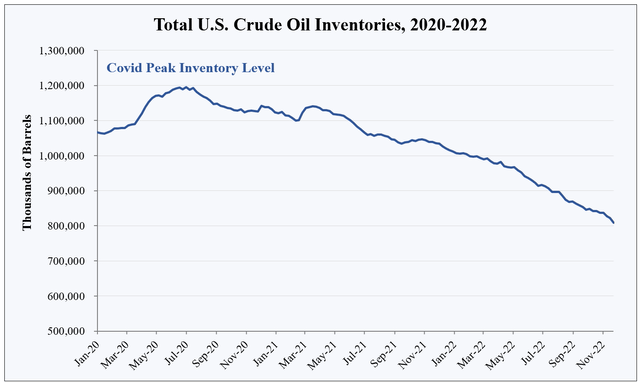
This drawdown—which is still underway—is the largest in history. It is also one of the longest. The next chart plots total U.S. inventories since the beginning of 2020. Notice the virtually uninterrupted decline since mid-2021.
EIA, HFI Research
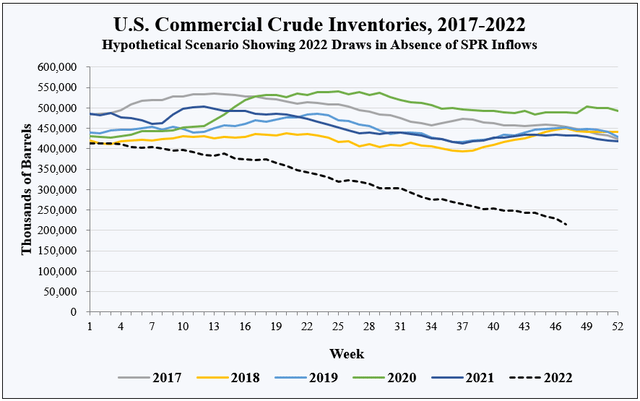
Oil prices are ultimately dictated by bidding among refiners for the barrels in commercial inventories. The data illustrate that SPR releases have prevented the U.S. commercial crude supply from slipping into the danger zone, where refineries run short of the supply necessary to produce refined products. In a hypothetical scenario in which SPR releases hadn’t occurred, the inventory drawdown would look like this:
EIA, HFI Research
With no SPR releases, U.S. commercial inventories would have drawn down toward the minimum level required by refineries to operate. This level includes the crude that must run through pipelines and sit in regional storage hubs and onsite at refineries to facilitate normal refinery operations.
In reality, the scenario depicted in the chart could not happen. Once inventories approach operating minimums, competitive bidding for crude among refiners would send prices soaring to levels that force demand to fall to levels in line with available supply. But the scenario illustrates the predicament in which the U.S.—and by extension, the world—finds itself. SPR releases in 2022 kept crude prices and crude supply lower and demand higher than they would have been if the market had been left alone.
Of course, the SPR releases can only be a temporary solution to a structural oil undersupply. By prolonging the adjustments necessary for the market to fix the undersupply, they actually make it worse over the long run.
The SPR releases that added 203 million barrels to U.S. commercial inventories at a rate of 1 million bpd are set to end in a month. In 2023, an additional 26 million SPR barrels are scheduled for release. These had been mandated by Congress in previous years to fund government programs. These barrels will reduce the flow of SPR barrels to 63,000 bpd, a sliver of the current supply deficit that global inventory changes indicate has ranged from 1 million bpd to 2 million bpd this year.
In the years 2024 through 2027, a total of 153 million barrels are earmarked for sale. These sales will add barrels at an average rate of 105,000 bpd. After these sales are complete, SPR volumes will have declined from 656 million in mid-2020 to 240 million barrels, enough supply to cover approximately 40 days of U.S. oil imports. This is less than half of the 90-day minimum that oil-consuming nations have pledged to keep in their SPRs. Any significant reduction below 40 days would leave the country vulnerable in a supply disaster like an oil embargo or a war and is therefore likely to be met with political opposition.
Without the steady inflow of SPR barrels in 2023, inventories are likely to continue their decline, barring a deep global economic recession or newly imposed travel restrictions that significantly reduce global oil demand. Given the strong inverse correlation between oil inventories and prices, the inventory decline will push prices far higher from today’s $80 per barrel. Eventually, inventories will decline to a point where prices will have to rise toward $150 per barrel, the level that forces a curtailment in demand. Moreover, high prices will have to be sustained until they incentivize a production response.
Bull Premise #2: OPEC’s Spare Production Capacity is Dwindling
In previous oil market disruptions and major shortages, OPEC has come to the rescue by increasing production. Going forward, the group’s ability to do so will be constrained by its thin margin of spare production capacity.
OPEC members are the only oil producers capable of strategically flexing their production at will. The rest of the world pumps full out in order to maximize oil revenue. OPEC members are therefore the only oil-producing nations that boast spare production capacity in excess of their current output.
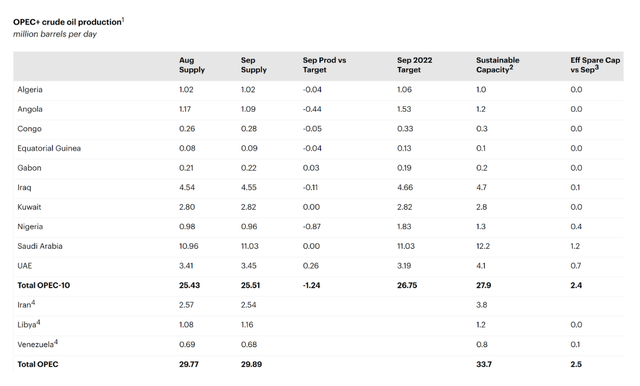
In its most recent Oil Market Report, the IEA lists OPEC’s spare capacity at 2.4 million bpd, half of which resides in Saudi Arabia. The table below is excerpted from that report.
IEA
Source: International Energy Agency, Oil Market Report, Nov. 15. 2022, pg. 20.
The IEA publishes each country’s submitted estimate of spare capacity with no editorializing. Historically, countries have inflated their spare capacity figures, as more spare capacity translates to greater geopolitical importance.
Saudi Arabia, for one, has been guilty of overreporting its spare capacity. Back in 2005, the kingdom reported it was capable of producing 15 million bpd. At the time, it was producing 9.5 million bpd, so its assertion implied it had 5.5 million bpd of spare capacity. Since then, the world has experienced periodic supply shortages, but Saudi production has only managed to exceed 11 million bpd for a few months at a time.
Today, Saudi Arabia claims it has 12 million bpd of total production capacity, which puts its spare capacity at around 1 million bpd. But the oil market participants are skeptical that Saudi Arabia can sustain output at a higher rate than its current 10.6 to 11.0 million bpd because the kingdom has never pumped more than 10.6 million bpd for longer than six months at a time. While Saudi Arabia could draw down its substantial oil inventories to increase its “supply” to market—as it has done several times over the past few years—geological constraints likely prevent it from increasing production above 11 million bpd for a sustained period, since doing so would risk permanent damage to the kingdom’s aging carbonite reservoirs.
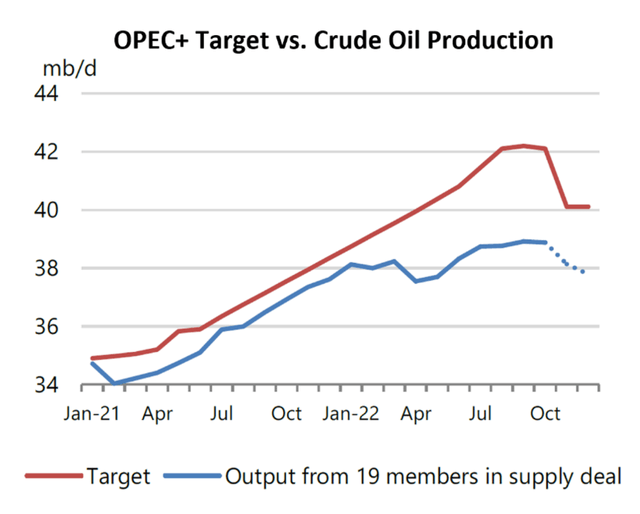
Additional evidence of OPEC’s production constraints is reflected in the failure of member nations to meet their respective supply quotas. This is an unprecedented state of affairs for the group. In fact, most OPEC members’ production maxed out months ago. As a result, Saudi Arabia, the UAE, and Kuwait have shouldered most of OPEC’s production increase since the group cut supply to rebalance the market in 2020. The gap between OPEC’s actual production and its members’ quotas, which has been as much as 3 million bpd, is shown in the chart below.
IEA
Source: International Energy Agency, Oil Market Report, Nov. 15. 2022, pg. 16.
Consider, for example, that Nigeria is currently producing slightly less than 1 million bpd, as shown in the OPEC production table above. The table also shows Nigeria’s claim that it possesses 400,000 bpd of spare capacity. If Nigeria truly possesses 1.4 million bpd of total production capacity, why isn’t it pumping at full capacity to get its production more closely in line with its OPEC quota of 1.8 million bpd? After all, doing so would provide sorely needed funding for its cash-strapped government. The fact of the matter is that Nigeria isn’t pumping more than 1 million bpd because it can’t. Other OPEC members similarly exaggerate their spare capacity estimates, which, in turn, exaggerates the IEA’s published spare capacity figures.
The reality on the ground is that OPEC’s spare capacity is nowhere near the IEA’s reported 2.5 million bpd. The actual number for an OPEC production surge that lasts any more than a few months is likely between zero and 1 million bpd, consistent with Amin Nasser’s comments.
Conclusion
Declining oil inventories and diminishing OPEC spare capacity are squarely in the oil bulls’ favor over the long term. In Part 2, we’ll take a look at U.S. shale production and the outperformance of oil equities as further reasons to be confident that the long-term bullish fundamentals are intact. With the multi-year outlook continuing to support the oil bull thesis, we recommend that long-term investors take advantage of the downdraft in oil equities to buy high-quality oil-related names.