RE:RE:RE:RE:Today's action. The ascending triple top breakout is a bullish indicator in P&F charts, unlike other charting.
If the price of the stock was in a down trend before, the ascending triple top breakout would signify a reversal in the previous trend. In Flyht's case where we were in a up trend, it signals a continuation of the trend.
There are five bullish breakout P&F patterns. The most basic P&F buy signal is a Double Top Breakout, which occurs when an X-Column breaks above the high of the prior X-Column. From this basic pattern, the bullish breakout patterns become more complex and wider. The wider the pattern, the better established the resistance level and the more important the breakout. This article will look at the five key breakout patterns in detail and show measuring techniques for Price Objectives.
Double Top Breakout
In the P&F world, Double Top Breakouts are bullish patterns that are confirmed with a resistance break. With bar charts, on the other hand, Double Top Breakouts are bearish patterns that are confirmed with a support break. These patterns are not contradictory. They are simply different patterns with similar names.
As noted above, the most fundamental P&F buy signal is when an X-Column breaks above the high of the prior X-Column. These two columns are separated by an O-Column. X-Columns denote rising prices, while O-Columns signify falling prices. The first rising X-Column establishes direction. The middle O-Column represents a bounce that establishes support. The third X-Column triggers the higher high. The ability to break above the prior high shows strength associated with an uptrend.
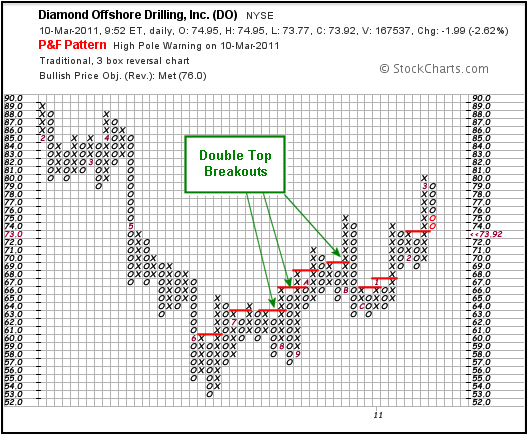
As the most common signal in the P&F universe, Double Top Breakouts are also the most prone to whipsaw and failure. These breakouts should be viewed in the context of the bigger picture. It is important to employ other aspects of technical analysis when using signals as common as Double Top Breakouts. The chart below shows Diamond Offshore (DO) with several Double Top Breakouts over the last two years.

Triple Top Breakout
The Triple Top Breakout takes the Double Top Breakout one step further by adding a resistance column. Two consecutive X-Columns define resistance with two equal reaction highs. The third X-Column breaks above the prior two X-Columns to forge the Triple Top Breakout. Classic Triple Top Breakouts are five columns wide: three X-Columns and two O-Columns.
These patterns can mark reversal breakouts or continuation breakouts. Distinguishing between reversal and continuation depends on the prior move. A Triple Top Breakout that forms as a base after a decline would be deemed a reversal pattern, while a Triple Top Breakout that forms as a consolidation after an advance would be viewed as a continuation pattern.

The chart above shows Computer Sciences (CSC) with a reversal Triple Top Breakout at the end of 2008 and then two continuation Triple Top Breakouts. While it is sometimes difficult to distinguish between reversal patterns and continuation patterns, the Triple Top Breakout itself is easy to identify.