RE:What's going on with the Suncor share priceNot as I see it.
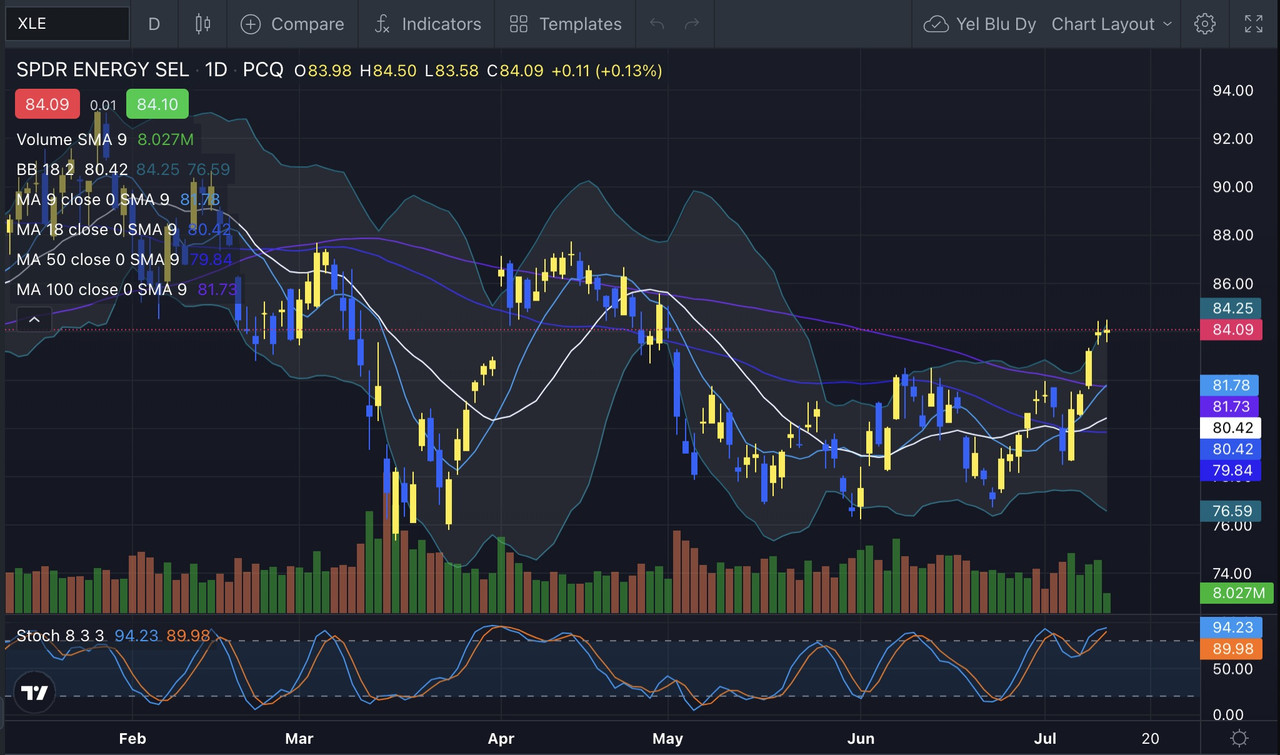
SU and Canadian oils follow XLE, the US producer index ETF.
All are lagging, today it was Suncor's turn to lag more. A couple days ago it was CVE turn.
Notice that the XLE 1 Day chart is at resistance, hitting the top Bollinger band, and is getting sold off, preventing a breakout.
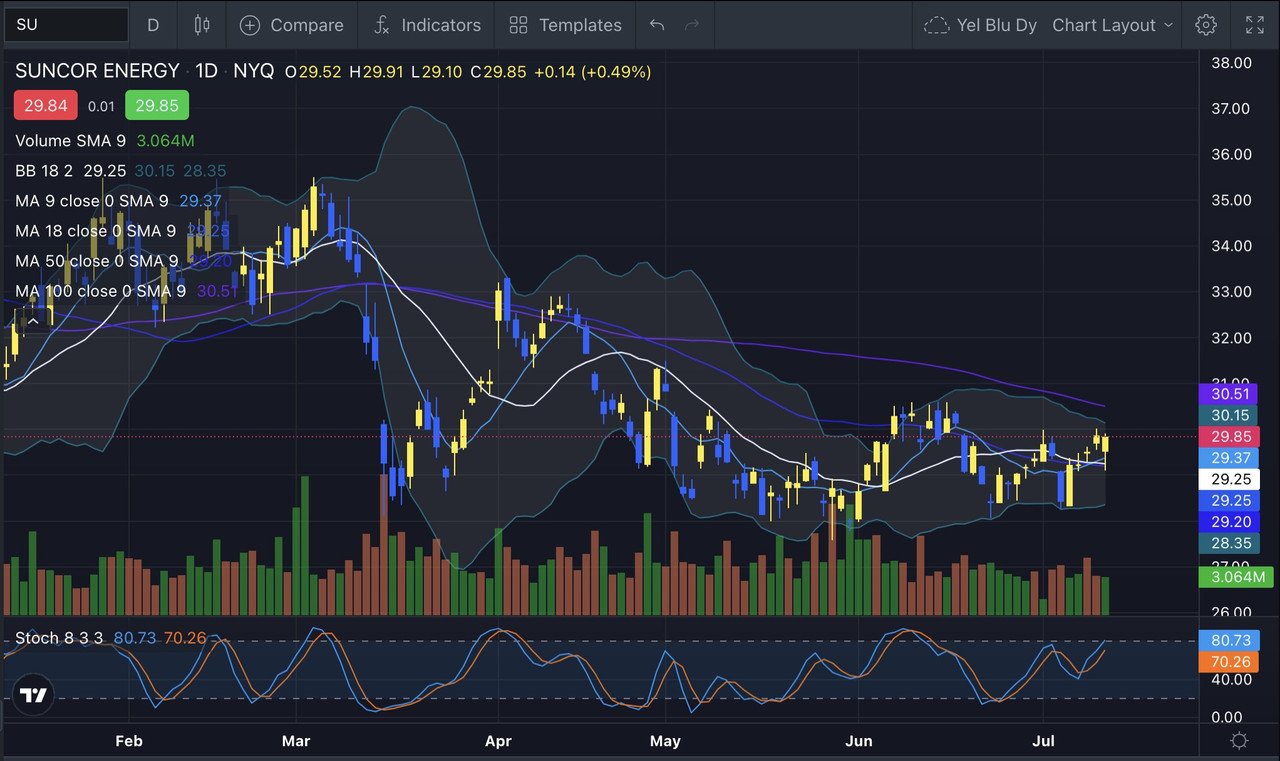
Now SU still has a bit more room to rise before it hits its own top Bollinger band level. Noticing the large discrepancy, I took a 20,000 share SU buy as it fell near the open on today's weakness, and sold a few minutes later on the 29 minute mark after it recovered, just as a trade, +11$K profit.
This undervalued situation still persists, and can be exploited long term or even as a daytrade. All our heavy oil producers have a long way to run yet, and I am biased to the upside for trading and for long term core positions.
For charting, I follow SU action on the US side, as most algos do.
XLE:

SU:

Obscure1 wrote: WTI is approaching $77 but SU is stuck at $39.
The relationship that has existed between WTI and SU for as long as I have been watching (a couple of years) seems to be broken.
It's right in front of our faces. Everybody sees it. Does anyone have an explanation other than nobody wants to touch SU?
As a long term investment I wouldn't touch SU with a ten foot pole unless the company executes a shift in its business model, but come on, there has to be more to the story as this looks like a short term opportunity.