
Jacob Boomsma/iStock via Getty Images
Summary
Artis REIT (TSX:AX.UN:CA) is a diversified REIT that owns a portfolio of industrial, office, and retail assets in the US and Canada. Its unit price has suffered since the beginning of the rate hike cycle, falling from over $13/unit to ~$6.3/unit. We were interested in looking at Artis due to its large sell-off, apparently cheap valuation, high yield, and active approach to value realization. We thought there could be an opportunity if we could look through the noise of the failed strategic review, office exposure, and large skew towards secondary and tertiary markets. In the end, we found the units carried much more risk than we felt was tolerable given the return potential, and we chose to initiate at a Hold.
Portfolio Snapshot
Artis is a diversified REIT with a portfolio of industrial, office, and retail assets across the US and Canada. The Canadian portfolio is heavily weighted towards Western Canada (i.e., Alberta, Saskatchewan, Manitoba, BC). The US portfolio is relatively evenly distributed across 5 Southern, Central, and Midwestern states. By GLA, industrial represents ~42%, office ~45%, and retail ~13%.
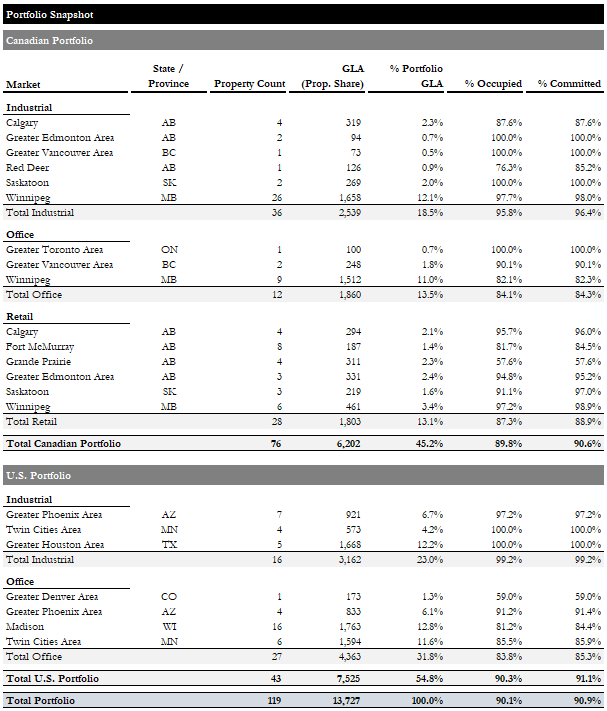
Portfolio Snapshot (Empyrean; AX)
The largest tenants across the portfolio consist of a mix of high-quality, creditworthy tenants (e.g., Bell, governments, Shoppers Drug Mart, CBRE, Sobeys, etc.) and less financially sound or non-rated companies (e.g., Cineplex, Lucky Supermarkets).
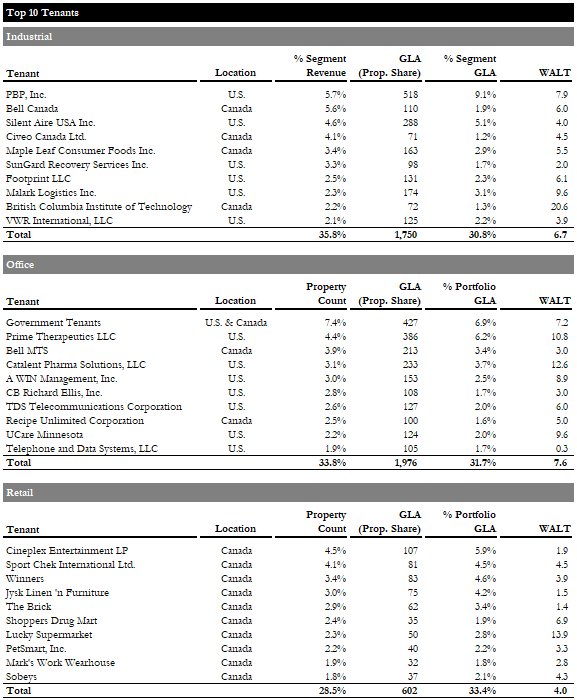
Top Tenants Summary (Empyrean; AX)
Artis is one of the only REITs we've looked at recently with above-market in-place rents. It has ~11% of GLA expiring this year, which is set to be leased at rents ~2% lower based on management's estimates of market rents. Notably, office rents are expected to reprice ~5% lower, assuming they can lease all of the space, and industrial rents are set to decrease by <2%, extremely low for what we've seen in other industrial REITs.

Loss-to-Lease (Empyrean; AX)
Against the backdrop of a shrinking portfolio, this further clouds the outlook for any meaningful re-rating of the units.
Strategic Review / Asset Sales
Last August, Artis established a special committee to conduct a strategic review of alternatives to maximize value for unitholders and hired BMO as an advisor. Unsurprisingly, there was minimal investor appetite to acquire the REIT at a price anywhere near the book NAV, and the process was recently terminated.
Rather, Artis has pursued significant asset sales to repay debt and manage liquidity. The asset sales have strongly favored industrial and retail assets, which have been good performers compared to office, and are much easier to sell at reasonable prices and on good terms from Artis' perspective (i.e., without VTB financing).

Disposition Summary (Empyrean; AX)
Usually, capital recycling or asset disposal programs serve to increase the quality of a portfolio by selling lower quality, "non-core" assets, and reinvesting the proceeds accretively (e.g., buying higher quality or cheaper properties, debt paydown, returning cash to shareholders). Unfortunately, Artis' asset disposal program has seen it sell off its higher-quality industrial and retail assets to repay debt and retire units. This is a function of the company's "value investing" strategy. We consider ourselves value investors but do not see Artis' interpretation of this strategy as optimal. In fairness, asset sales have been necessary to manage liquidity and reduce leverage, and excess proceeds have been wisely used to repurchase units, and office properties are not the easiest assets to sell at attractive values right now. However, the preferential sales of industrial and retail assets have increased its office exposure from <40% of GLA to >45% and ~48% of NOI to ~51% since Dec-21. With the outlook for office remaining bleak and management's only ideas for value creation being debt reduction and buying its own stock, we see this as a risky strategy - essentially doubling down on offices.
Recent Performance
Earnings & Cash Flow Evolution
Since beginning its initial strategic review in Mar-21, Artis has divested a large number of 'non-core' assets, significantly changing its portfolio composition. It has sold 24 industrial properties, reducing industrial GLA by ~35%, 8 office properties, reducing office GLA by ~12%, and 5 retail properties, reducing retail GLA by ~16%. Since YE24, average rents grew at a ~9% CAGR in the industrial portfolio, ~3% in the office portfolio, and ~1% in the retail portfolio. The industrial portfolio has been high-graded by the dispositions, with its rent growth significantly above certain other industrial REITs (e.g., Granite had a ~6% ABR CAGR over the same period, ~300bps lower than Artis). However, the office and retail portfolios saw much more subdued rent growth. While the industrial portfolio remained nearly fully occupied, the office and retail portfolios have seen declines. This is to be expected in office, but is somewhat surprising in the retail portfolio given the strength we have seen in other retail portfolios.
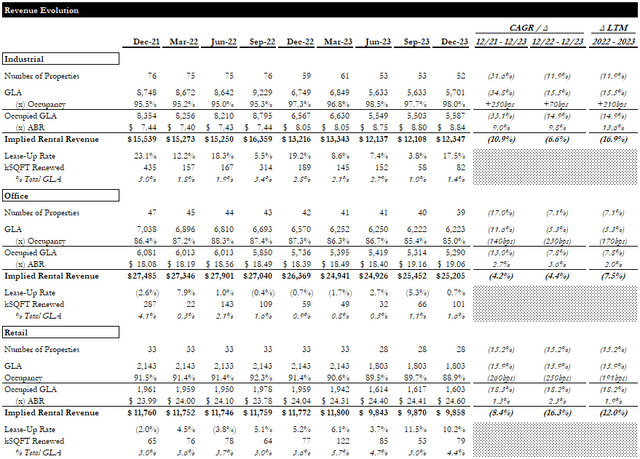
Revenue Evolution (Empyrean; AX)
With the portfolio shrinking over the past two years, NOI has declined across all portfolios. Artis does not provide sufficient disclosures to analyze accurate NOI margins by segment, but they have remained fairly consistent at the group level.

NOI Evolution (Empyrean; AX)
Against the backdrop of a shrinking portfolio and the accompanying decline in NOI, interest costs have increased markedly, crushing FFO and AFFO. Unit repurchases have only a minor salve to this, with FFO and AFFO per share still declining at ~12% and ~20% CAGR, respectively.
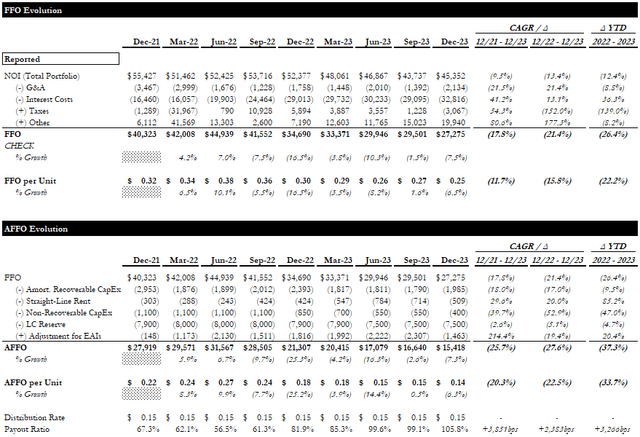
Cash Flow Evolution (Empyrean; AX)
Looking ahead, we expect the industrial and retail portfolios to continue to perform well, given the landlord-friendly supply/demand imbalance in those markets. Unsurprisingly, we are not very excited about the prospects for the office portfolio. Upcoming debt maturities (discussed in the Leverage section below) and asset sales will continue to pressure FFO and AFFO per share. Based on the LQA figures, the distribution appears unsustainable. Given the high leverage profile and cash flow pressures, we place a relatively high probability of a distribution cut over the NTM, likely later in the year.
NAV Evolution
The following analysis unpacks the components of Artis' reported NAV evolution over the past 2 years. The carrying value of investment properties fell ~26% cumulatively over this period, roughly equally attributable to asset sales and rising cap rates (n.b., blended portfolio cap rate expanded by ~50bps, though this is not very meaningful given the changing mix of industrial/office/retail). Despite the significant reduction in the size of the portfolio, liabilities fell by only ~5%. Repurchases of preferred shares reduced their carrying value by roughly a third. On balance, the total NAV attributable to common unitholders decreased by ~23%.
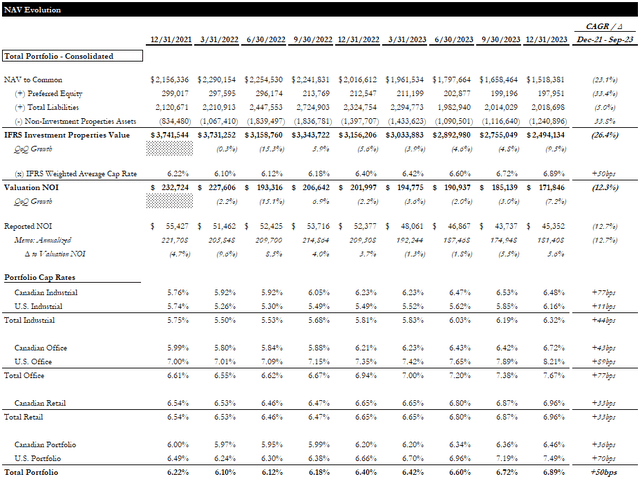
NAV Evolution (Empyrean; AX)
Significant unit repurchases (n.b., ~12% net reduction) helped mitigate the NAV decline to ~12% on a per-unit basis.
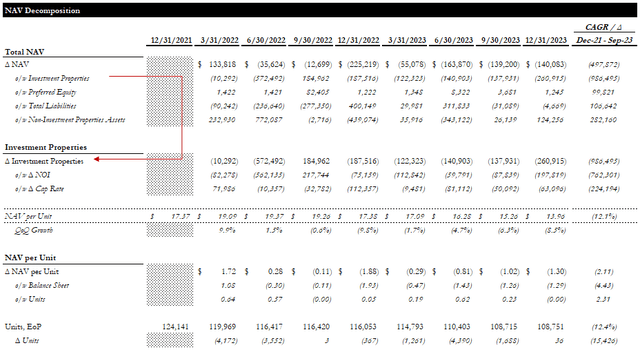
NAV Evolution Decomposition (Empyrean; AX)
Leverage
Artis' high leverage is one of the market's major concerns with the REIT. Including the preferred equity, D/GBV is relatively high at ~66%. Again including the prefs, ~43% of debt is fixed rate (n.b., ~34% excluding the pref). At this point in the interest rate cycle, we are starting to shift the way we think about floating rate exposure risk. When base rates are lower, and inflationary pressures are building, high floating rate exposure is obviously a major risk. Conversely, when base rates have likely peaked, higher exposure to floating rates can set a company up for relative outperformance, at least in terms of cash flow growth, when rates fall. For that reason, we do hold Artis' floating rate exposure against it. Nevertheless, overall leverage is too high, as evidenced by interest costs eating up +70% of NOI.
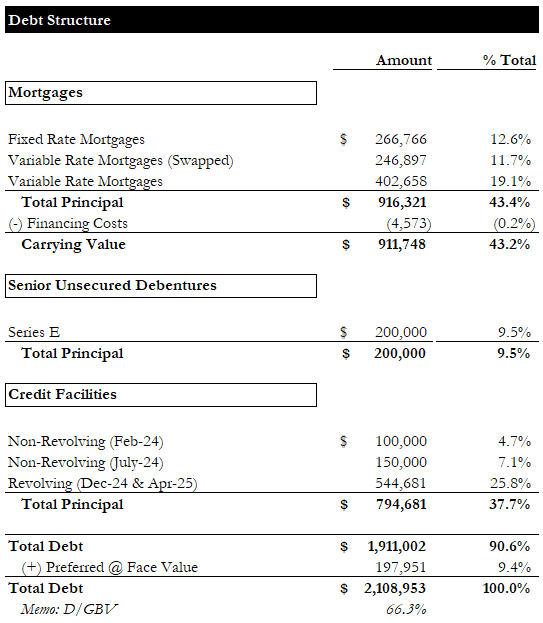
Debt Structure (Empyrean; AX)
Valuation
Artis trades for ~6.3x LQA FFO and ~11.1x LQA AFFO, ~84% of our NAVPU estimate (n.b., ~8.1% implied cap rate), yields ~9.6%.
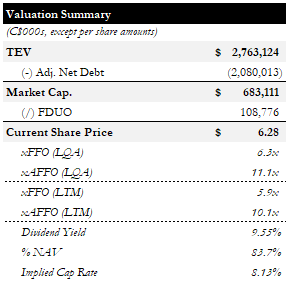
Valuation Summary (Empyrean; AX)
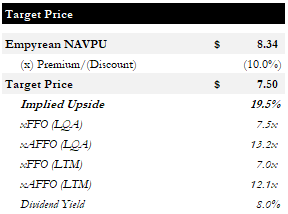
Our NAVPU estimate is ~$8.3/unit, to which we apply a 10% discount to arrive at our target price of $7.5/unit. Since 2009, Artis has traded for an average P/NAV of ~84%. Even with our NAV estimate being ~40% lower than the Q4 reported NAVPU, we apply a further discount to account for its higher leverage, diversified portfolio (diversified REITs are currently out of favor), and high office exposure.
Target Price (Empyrean)
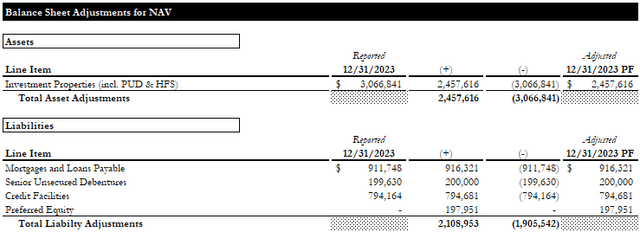
The major balance sheet adjustments used in our NAV calculation are shown below. We used a ~7.5% blended cap rate for the investment properties valuation (n.b., ~6.6% on industrial, ~8.2% on office, and ~6.8% on retail). Our NTM NOI is ~1.4% lower than FY23, assuming flat rents and declining occupancy in the office portfolio.
Balance Sheet Adjustments (Empyrean; AX)
Our target price implies ~20% upside, which seems reasonably attractive. However, the risk of a distribution cut over the next year, the relatively lower quality of the portfolio, and near-term pressures posed by above-market rents and elevated leverage make us far less interested at the current price. We see several alternatives with comparable or superior return profiles and more manageable risk profiles.
Conclusion
Our price target is based on a 10% discount to our NAV estimate and implies a moderately attractive ~20% upside. However, we do not believe the market is heavily focused on NAV as its preferred valuation metric for Artis. On an FFO/AFFO multiple basis, Artis appears relatively in line with its lower-quality diversified peers. Its aggressive asset sale program, elevated leverage, and low to negative rent mark-to-market all serve to reduce Artis' growth potential, making multiple expansion unlikely. Furthermore, the stretched payout ratio increases the probability of a distribution cut over the coming year. Considering these risks, we are not ready to make a bullish call.
There are 2 catalysts we are looking for that may change our mind: (1) interest rate cuts and (2) positive developments in office market fundamentals. The first is purely a waiting game, but the timing, pace, and intensity will determine the ultimate impact on our valuation. The latter we see as highly unlikely over the next year, and likely something to keep an eye on for '25.
All that being said, we can't argue that Artis trades cheaply. This, and management's heavy buyback activity, keep us from a Sell rating. We are going with a Hold rating to reflect our wait-and-see attitude.
Editor's Note: This article discusses one or more securities that do not trade on a major U.S. exchange. Please be aware of the risks associated with these stocks.