In this installment of the ‘Agronometrics In Charts’ series, Sarah Ilyas studies the state of the organic berry market in the US. Each week the series looks at a different horticultural commodity, focusing on a specific origin or topic visualizing the market factors that are driving change.
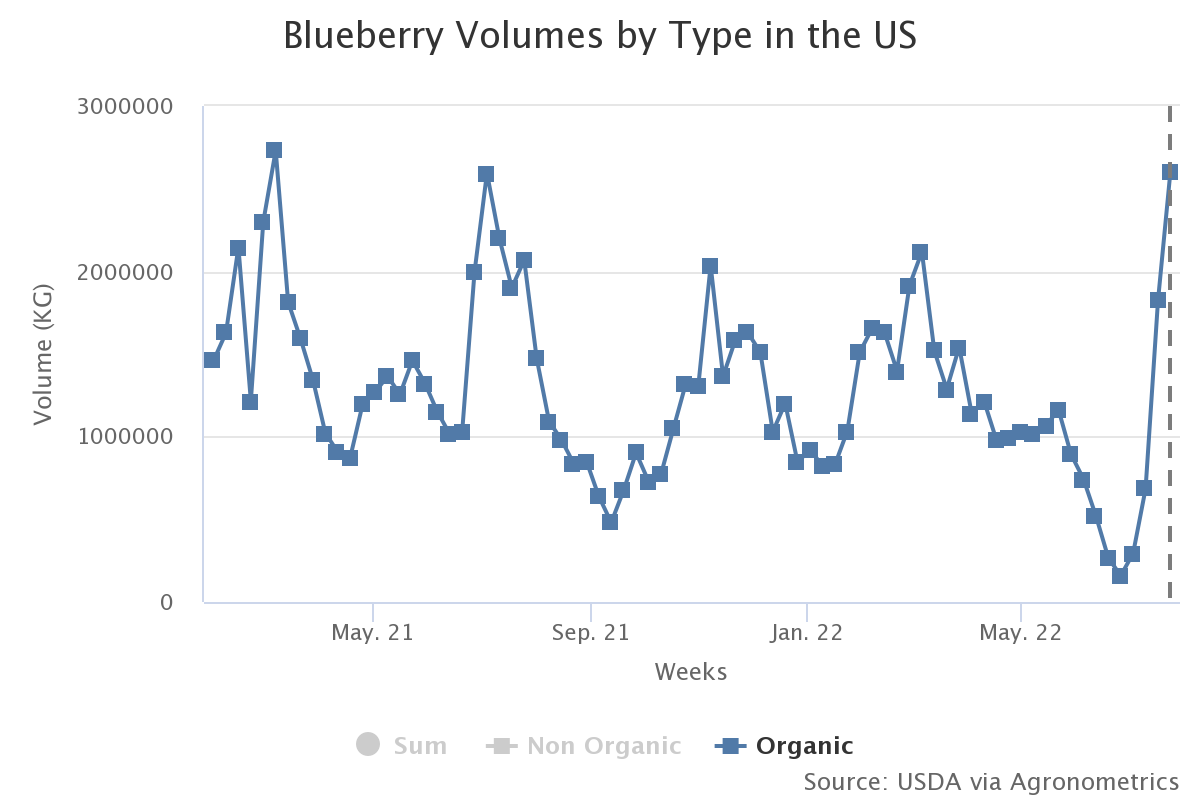
The delayed start to the blueberry season follows the cool wet spring seen in the Pacific Northwest, supplies of organic blueberries, however, are building. “We are in the peak of the front side of the season, says Michael McMillan of Bridges Produce. Washington State has a fabulous crop of mid-late season and late-season blueberries. We will ship through most of September and there’s a lot of Peruvian product coming in very early this season and we’d love to get domestic support to move our crop. We had the most precipitation on record in Western Oregon between April and June and temperatures were just below normal over the 10-year-average that just delayed maturity,” adds McMillan.
Berry grower-shippers are reporting a robust demand for organic berries. “It feels like the production world has invested heavily into developing organic supply and there’s been much less, especially as we get later into the season, conventional supply available. So conventional has been really tight while organic there’s been fruit available,” he says. “We’re now where some of the retail demand has been filled a bit and things feel fuller. But we anticipate that clearing out in the next couple of weeks and a great August ahead,” he adds.
Source: USDA Market News via Agronometrics.
(Agronometrics users can view this chart with live updates here)
Washington state has some of the highest agricultural labor costs in the country. “This being the peak, there is some product being moved at aggressive pricing. Ultimately, we are asking for modest price increases over last season that we’d love to maintain through September,” says McMillan. Nick Wishnatzki, public relations manager of Plant City, Fla.-based Wish Farms expressed concern that the impact of high inflation could nudge consumers to buy nonorganic items and temporarily put the brakes on the growth of the organic category.
Source: USDA Market News via Agronometrics.
(Agronometrics users can view this chart with live updates here)
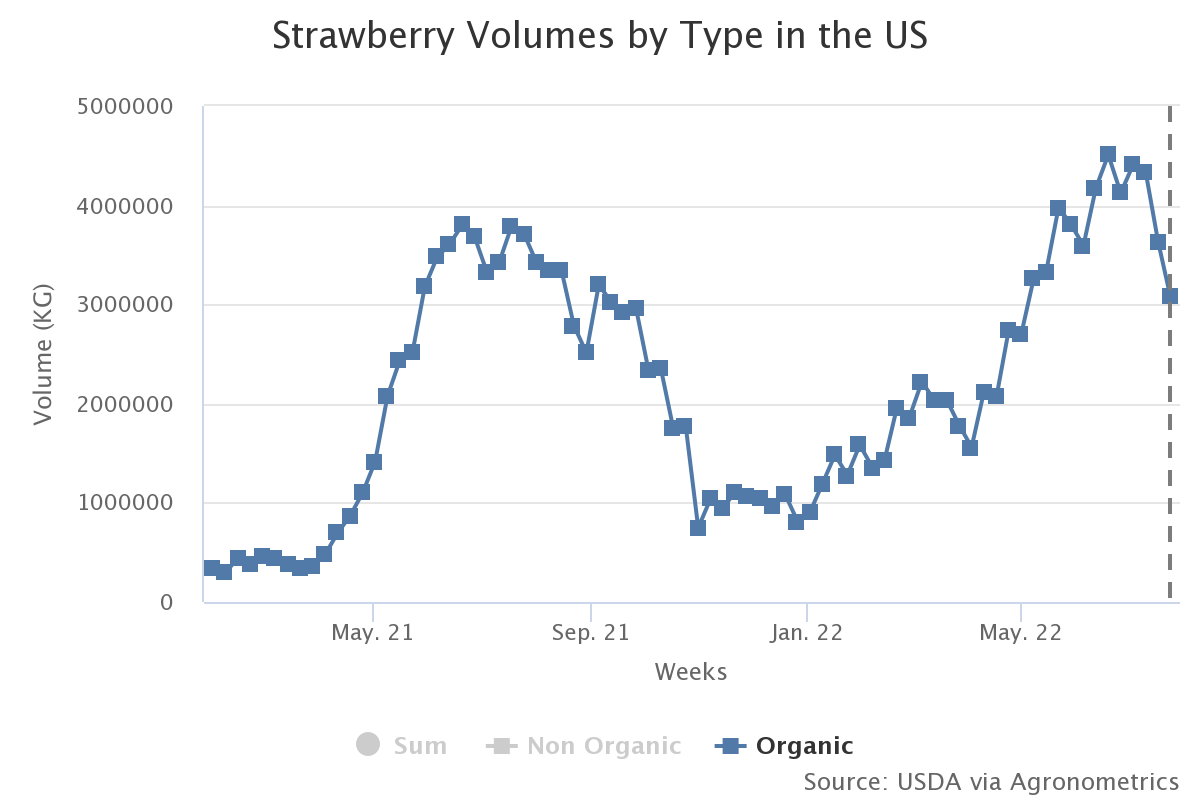
Strawberry taste, size and quality have been favorable this summer for Irvine, Calif.-based Gem-Pack Berries LLC, said Craig Casca, chief marketing officer. Warm weather, however, presented a few challenges earlier in the season. “It was a warm June,” he said. By mid-July, the company was shipping mostly medium/large strawberries. In its July 18 crop report, Watsonville, Calif.-based California Giant Berry Farms said its Santa Maria, Calif., conventional fall crop quality was “great with nice shape and size.” “Production continues with a slight downward trend,” according to the report.
Source: USDA Market News via Agronometrics.
(Agronometrics users can view this chart with live updates here)
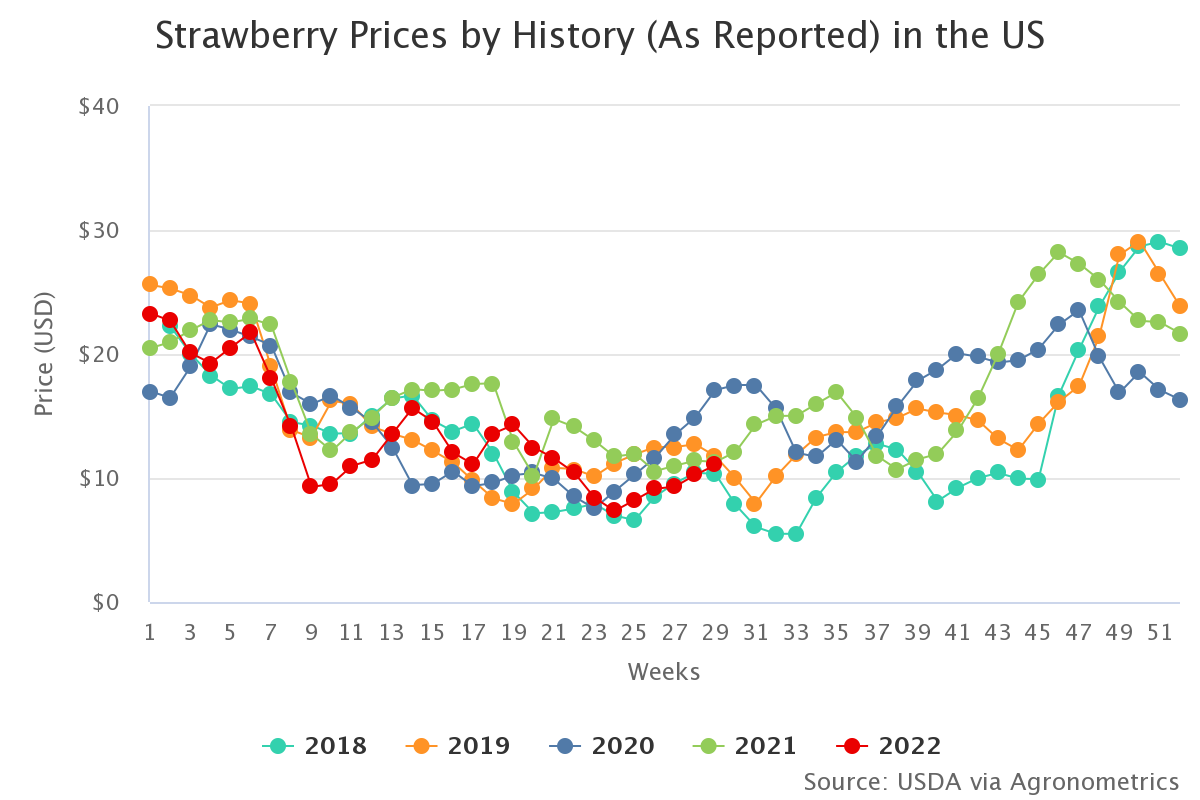
“Organic pricing has been pretty reasonable,” says Grabowski. USDA reported that fob prices of eight 1-pound trays of small/medium organic strawberries were mostly $9-$10 on July 18. The state has 4,584 acres of organic strawberries this year, according to the California Strawberry Commission.
Source: USDA Market News via Agronometrics.
(Agronometrics users can view this chart with live updates here)
In our ‘In Charts’ series, we work to tell some of the stories that are moving the industry. Feel free to take a look at the other articles by clicking here.
All pricing for domestic US produce represents the spot market at Shipping Point (i.e. packing house/climate controlled warehouse, etc.). For imported fruit, the pricing data represents the spot market at Port of Entry.
You can keep track of the markets daily through Agronometrics, a data visualization tool built to help the industry make sense of the huge amounts of data that professionals need to access to make informed decisions.If you found the information and the charts from this article useful, feel free to visit us at www.agronometrics.com where you can easily access these same graphs, or explore the other 21 commodities we currently track.
Written by: Sarah Ilyas