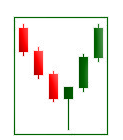
Hammer
A 1-candle pattern. It can signal an end of the bearish trend, a bottom or a support level. The candle has a long lower shadow, which should be at least twice the length of the real body. The color of the hammer doesn’t matter, though if it’s bullish, the signal is stronger.
Hammers occur frequently and are easy to recognize. They show that although bears were able to pull the price to a new low, they failed to hold there and by the end of a trading period lost a battle with buyers. The signal is stronger if a hammer forms after a long decline in the price.

Moreover, the buy signal will be more reliable if a hammer is followed by a candlestick that closes above the opening price of the candlestick on its left. Here’s how a hammer looks at the real chart: