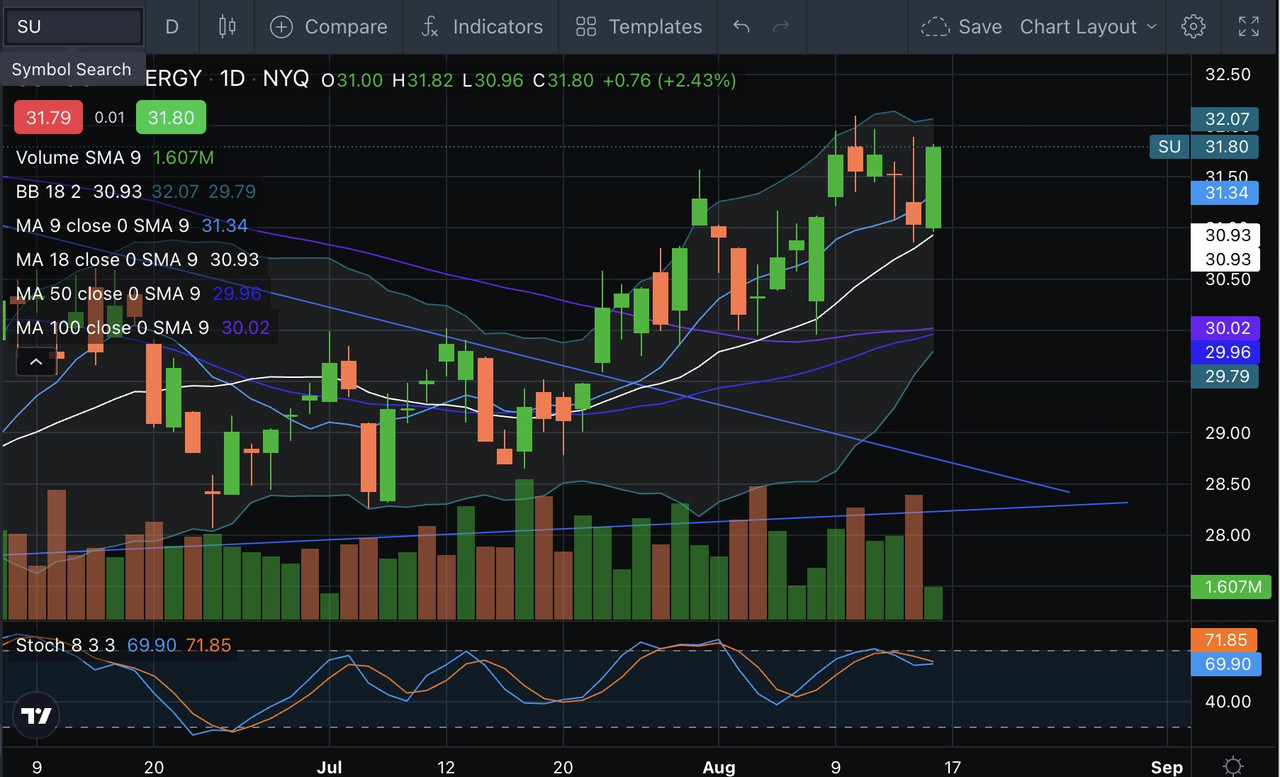
Suncor on NYSE has been a dream trade ever since it broke out of the 12 month bullish pennant on July 24.
Unusually for me, I'm going to set aside discussing the bullish fundamentals in the oil market for now, and focus on the chart.
For technicals, I watch the NYSE rather than the TSX, as that is what the algos do.
Here's a longer term chart of the SU daily NYSE showing the bull pennant and breakout:

Now here is the same daily chart, zoomed into to see the recent daily price action.
Note the strong support of the 18 DMA white line, and the resistance of the upper Bollinger band. The Bollinger band is a moving average algorithm that keeps the price action within the range 95% of the time.

As long as it stays above the 18 DMA, the trade is valid.
I am very overweight SU, but have been taking profits on portions of my position as it gets near the upper BB, and rebuying it down near the 18DMA for the bounce.
I set buy and sell prices a few cents on the insides of this range to get a fill, as sometimes it gets close, and you miss the cycle.
Looking back, when you consider how hammered down SU has been this past year as it has been the ugly duckling of the oilsands producers, and realizing the significant potential upside it has as it climbs back toward those $42 USD highs, the strategy could have a lot of life left to play out.
This kind of trade works until it doesn't, but chances are your account will have grown substantially by the time your stops get taken out.
The nice rare thing with this trade is that you can set your buy and sell orders in advance, ignore it all day, and let it play out.
GLTA