Canan turan/iStock via Getty Images
Every morning, I run through a list of charts I've collected over the past several years to "gauge" the overall market. This mental exercise helps my subconscious to process the charts throughout the day and let my "gut instinct" tell me where we are headed next. Instead of short-term charts, I like to look at the bigger picture ones to form a thesis in my head.
One chart in particular that I've used before is the low beta vs high beta energy stock.

stockcharts.com
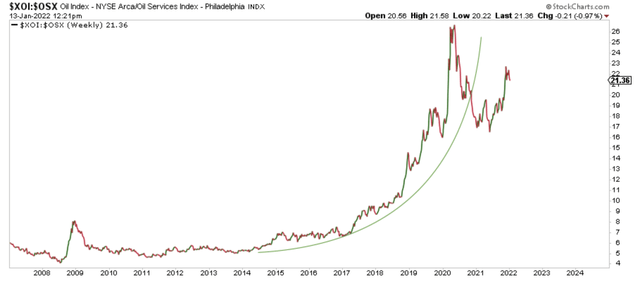
To be exact, it's the oil index (a benchmark of integrated oil majors and large oil producers) versus the oil service index (oilfield servicing companies and high beta oil names). In the realm of the energy sector, these are essentially two polar opposites of the same coin. Integrated oil majors are the most insulated from oil price volatility, while oilfield servicing companies are the most vulnerable since they have no ways of hedging the oil price fluctuation and the E&P spending habits.
In the past, the low beta has always outperformed the high beta names during a bear cycle. You can see that mini gap-up back in 2008-2009. But this cycle has been significantly more brutal than the past lasting from 2014-2020.
As the cycle started to peak in 2020, we saw high beta names materially outperform from March to June 2021. But that outperformance took a pause as new COVID variants sent investors back on the sidelines. This is another reason why for those of you wondering why energy stocks are not living up to their true potential (fair value), look no further than the fund flows.
But as the chart above shows, we're approaching the apex of this short-term pause.

Dr. Jean-Paul Rodrigue
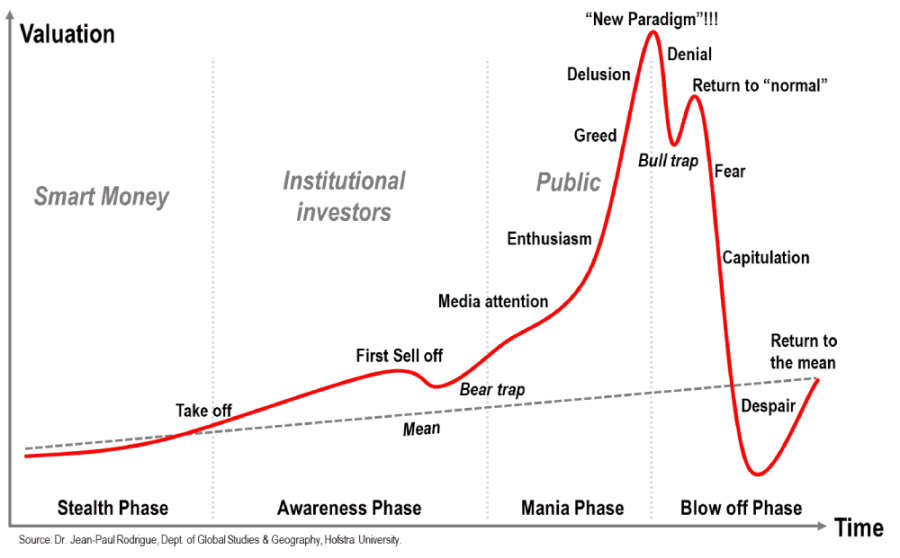
There are a lot of similarities with this financial bubble chart above. There was a parabolic rise with a bull trap (or bear) followed by a drop. But in this case, the "fear phase" is just high beta outperforming low beta names.
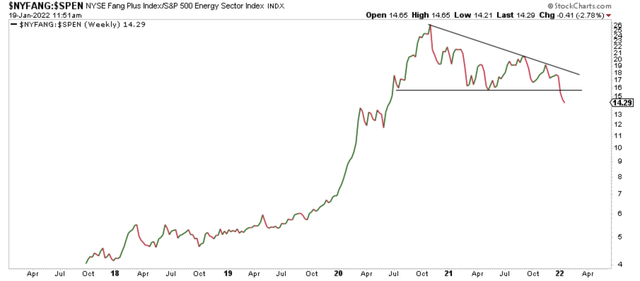
Another way we can gauge the overall direction of where energy stocks are headed is by pitting it against the market leaders or the FANG stocks. Looking at the relative chart, there was a surprising break to start 2022.

stockcharts.com
Not a lot of people are talking about this yet, but a breakdown in the FANG+ vs. energy is an indication that energy is going to start to take the leading role going forward.
What's a bit astonishing about our write-up today is that energy stocks are actually performing very well to start the year, and while I'm constantly paranoid, the charts tell me a different story. The low beta vs. high beta energy chart tells me there's a long way to go still in the energy sector rotation rally. Small names are still far from their fair value, and so as the sector rotation continues, remain long high beta names.