TPG Specialty Lending, Inc. Sends Letter to Independent Directors of TICC Capital Corp. Seeking an Objective Evaluation of
TICC’s Recent Financial Performance and Actions
TSLX Highlights Discrepancies in TICC’s Public Statements Compared to the Reality of its Investment Portfolio and Recently
Reported Financial Results
Calls for TICC’s Independent Directors to Resign if Directors Are Unwilling or Unable to Fulfill Their Duties to
Stockholders
TSLX Poses Six Important Questions on Behalf of All Stockholders to TICC’s Board Regarding the State of Stockholders’
Investment in TICC
TSLX Encourages TICC Stockholders to Vote the GOLD Proxy Card to Terminate TICC’s External Adviser’s Advisory Contract
and Elect T. Kelley Millet to the TICC Board of Directors at the 2016 Annual Meeting on September 2, 2016
TPG Specialty Lending, Inc. (“TSLX”; NYSE: TSLX), a specialty finance company focused on lending to middle-market companies, has
delivered a letter to Mr. Steven P. Novak, Mr. G. Peter O’Brien and Ms. Tonia L. Pankopf, the independent members of the Board of
Directors of TICC Capital Corp. (“TICC”; NASDAQ:TICC), urging that they answer six important questions for all stockholders as part
of an objective evaluation of the facts regarding TICC’s underperformance. In the letter, TSLX notes several discrepancies between
TICC’s public statements and the reality of its investment portfolio and recently reported financial performance.
This Smart News Release features multimedia. View the full release here: http://www.businesswire.com/news/home/20160829005496/en/
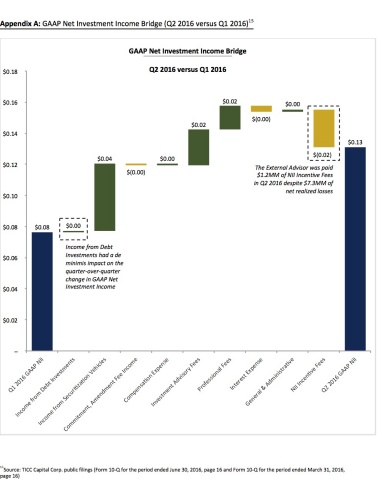
Appendix A - GAAP Net Investment Income Bridge (Q2 2016 versus Q1 2016)(Graphic: Business Wire)
TSLX strongly encourages stockholders to sign and return the GOLD proxy card today. TSLX urges stockholders to ignore
TICC’s self-serving actions and discard any WHITE proxy cards. Even if a WHITE card has been submitted, stockholders can still
change their vote, simply by returning the GOLD proxy card now. Voting instructions and TSLX’s proxy materials are also
available through the SEC’s website and at www.changeTICCnow.com.
A copy of the letter follows:
| Mr. Steven P. Novak |
| Mr. G. Peter O’Brien |
| Ms. Tonia L. Pankopf |
| TICC Capital Corp. |
| 8 Sound Shore Drive, Suite 255 |
| Greenwich, CT 06830 |
Dear Independent Directors,
We are writing as the largest single stockholder of TICC Capital Corp. (“TICC” or the “Company”) to urge you to critically
evaluate TICC’s recent performance and public statements. Although it may be difficult, given TICC’s substantial underperformance
during your tenure, we are hoping that you will take a step back and look at the facts objectively.
Like many others in the investment community, we continue to be frustrated by the actions taken by TICC’s external adviser to
avoid a constructive dialogue regarding the Company’s operations and results. A case in point is TICC’s refusal to issue its
quarterly report on Form 10-Q prior to conducting its earnings call with stockholders. Not only does this demonstrate a profound
lack of respect for the views of TICC’s stockholders and equity research analysts, it prevents any meaningful public discourse
regarding TICC’s performance, strategy and execution, thereby enabling poor performance to continue unchecked. As a result, we feel
obligated to raise publicly several important questions to TICC’s Board on behalf of all stockholders regarding the state of their
investment:
| |
|
|
|
1.
|
|
What drove the change in the level yield at which TICC recognized GAAP revenue from
CLO equity investments in the second quarter of 2016 – the quarter immediately preceding the annual meeting at which
stockholders will vote on a proposal to terminate the external adviser’s contract?
|
|
|
|
|
|
|
|
|
|
|
|
|
|
Based on the schedule of investments included in TICC’s Form 10-Q filing, it appears that
substantially all of the reported increase in investment income per share resulted from a change in the level yield
assumptions that TICC utilizes to recognize GAAP revenue from its Collateralized Loan Obligation (“CLO”) equity
investments.1 During the second quarter of 2016, the level yield at which TICC recognized revenue from CLO equity
investments increased by approximately 50.6%, to 12.8% from 8.5% in the preceding quarter.2 This increase included
an approximately 24.8% increase in the cost-weighted average level yield applied to existing positions compared to the yield
used for the three months prior.
|
|
|
|
|
|
|
|
|
|
|
|
|
|
We note that, by contrast, the key metrics reflecting the underlying strength of your CLO equity
investments appear to have deteriorated. For example, cash-on-cash distributions declined by approximately
14% quarter-over-quarter and 27% year-over-year while junior over-collateralization cushions, which measure the health of
CLOs and can be used as a means to predict possible future cash distributions to equity holders, declined by approximately 5%
quarter-over-quarter and 17% year-over-year.3 Although GAAP permits management to revisit level yield
assumptions from time to time, as a stockholder, we want to understand the underlying rationale that drove TICC to undertake
discretionary changes to these assumptions in the second quarter of 2016, at a time when the external adviser’s performance
is being questioned by numerous independent analysts and advisors and the termination of its contract is up for a vote of
stockholders.
|
|
|
|
|
|
|
|
|
|
2.
|
|
Why was the $0.14 per share in realized losses not highlighted to
stockholders?
|
|
|
|
|
|
|
|
|
|
|
|
Although TICC reported $0.13 per share in GAAP net investment income (“NII”) for the
second quarter of 2016, the Company’s statement of operations show that this was driven principally by reduced expenses and the
change in level yield at which TICC recognized revenue on its CLO equity investments discussed above, neither of which have
much to do with the Company’s investment strategy or ability to deliver future earnings.4 |
|
|
|
|
|
|
|
|
|
|
|
Even more important to stockholders, we believe the Company’s second quarter earnings release
glosses over the magnitude of TICC’s net realized losses. Put simply, the $0.13 per share in GAAP NII that TICC reported
in Q2 2016 is more than offset by $0.14 per share in losses realized during the quarter.5 That means the
economic value within the control of management (excluding unrealized gains) that TICC delivered to stockholders in the most
recent quarter was NEGATIVE. It is not lost on stockholders that realized losses represent a permanent impairment of
stockholder capital.
|
|
|
|
|
|
|
|
|
|
3.
|
|
Why did TICC’s external adviser collect an NII incentive fee in the second quarter of
this year when the Company reported realized losses of $7.3 million? How can it justify any fee at all?
|
|
|
|
|
|
|
|
|
|
|
|
The Company paid its external adviser an incentive fee of approximately $1.2
million6 during the most recent quarter, at the same
time that the Company reported realized losses of $7.3 million. We were surprised to learn that this was a quid pro
quo for the so-called “best-in-class” fee waiver that was trumpeted by the Board earlier this year as a stockholder-friendly
measure. In connection with the fee waiver, the Board agreed that the look-back reference date for the payment of NII
incentive fees would be reset to April 1, 2016. As a result, any losses suffered by TICC’s portfolio
prior to April 1, 2016, whether realized or unrealized, will not affect the adviser’s ability to reap NII incentive fees
going forward. Using the term “waiver” to describe this is itself thus a misnomer. There
was no unilateral concession by the external adviser; instead the Board agreed to wipe clean the slate of accumulated losses.
This certainly cannot be in the best interest of stockholders, given the external adviser’s past performance. Through this
reset, the external adviser gets to start over, despite the decade of underperformance delivered prior to the resetting of
the threshold. As a result, TICC could realize losses of up to approximately $155.3 million7 and still be in a
position that it might have to pay incentive fees, this most recently completed quarter being a case in point. We suspect
that long-suffering TICC stockholders wish they could similarly wipe clean their losses in TICC’s shares.
|
|
|
|
|
|
|
|
|
|
4.
|
|
Has the Company actually implemented a new investment strategy?
|
|
|
|
|
|
|
|
|
|
|
|
In a November 18, 2015 public statement, the Company announced the sale of certain
syndicated corporate loans and stated that “a rotation out of lower-yielding corporate loan assets held within a leveraged
credit facility into higher-yielding loans held on a less levered basis represents a compelling strategy,” and on March 10,
2016, TICC CEO Jonathan Cohen announced on the fourth quarter of 2015 earnings call that management was “committed to rotating
out of CLO equity over time.” Your actions, however, appear to contradict your stated intent to implement a new investment
strategy. |
|
|
|
|
|
|
|
|
|
|
|
Instead of exiting CLO equity investments, however, TICC reported a meaningful increase in CLO equity investments during the second quarter of 2016, with $37.9 million of CLO equity
purchased during the quarter, which represented 51.6% of the second quarter’s new investment activity.8 CLO equity
investments now represent approximately 32% of TICC’s total investment portfolio at fair value, a meaningful increase from
the first quarter of 2016.9
|
|
|
|
|
|
|
|
|
|
5.
|
|
Why did TICC state that its new investment strategy is “already yielding
results”?
|
|
|
|
|
|
|
|
|
|
|
|
In its August 18, 2016 public statement, TICC claimed that “[t]he Company has revised its investment
strategy, which is already yielding results.” Setting aside the increase in CLO equity investments, which is certainly a part
of the old strategy, we must note that the Company’s financial statements show that interest income from debt investments
(where the impact of new middle market originations would be presented in your income statement) actually decreased to $8.7 million in the second quarter of 2016 versus $8.9 million in the first quarter of
2016,10 resulting in virtually no change in these debt investments’ contribution to total investment income on a
per share basis.11 Does a quarter-over-quarter decrease in income from debt investments really equate to
“yielding results”? How does TICC explain the discrepancy between how the Board describes its investment strategy and the
reality of the performance of its portfolio?
|
|
|
|
|
|
|
|
|
|
6.
|
|
Shouldn’t stockholders judge the performance of the Company for as long as management
has been in charge and not from the bottom of the market?
|
|
|
|
|
|
|
|
|
|
|
|
We agree with TICC’s August 18, 2016 public statement that the Company’s performance should be
“evaluated over a longer period.” On this point the facts are clear: TICC has underperformed nearly
every significant benchmark since its IPO in 2003.
|
|
|
|
|
|
|
|
|
|
|
|
Since 2003, the Company has delivered underperformance of NEGATIVE 182.9% as compared to the BDC
Composite.12 TICC’s Board and external advisor have been the stewards of an investment strategy that has
resulted in a 52% decline in net asset value (“NAV”) per share since 2004.13 How can the Company continue to
defend this drastic level of underperformance?
|
|
|
|
|
|
|
|
|
|
|
|
You have argued that stockholders should look only at a single period of time—since
2009. However, we find it misleading to only look at the Company’s results since 2009, because your results since that point
essentially reflect a recovery from your severe underperformance relative to peers prior to and during the financial
crisis.14 We note your attempt to cherry-pick results didn’t persuade ISS or the other proxy advisors. In fact, TICC
has delivered year-to-date returns of 14.7% in 2016, compared to 17.5% for the BDC Composite, demonstrating that even TICC’s
recent performance has been subpar. |
|
|
|
|
|
|
|
As TICC’s largest single stockholder, we continue to reiterate our commitment to enhancing the value of stockholders’ investment
in the Company. The above questions are critical to helping us and our fellow stockholders understand the leadership decisions
being made by you, TICC’s Board, and management. Stockholders deserve real answers.
We genuinely hope that the TICC board will look critically at its strategies, capital allocation policies and corresponding
performance. Independent experts have overwhelmingly expressed concern with TICC’s actions and underperformance, and have
urged stockholders to support our campaign for change. All three leading proxy advisors have
recommended that stockholders support our efforts. Even if you ignore the facts outlined above, consider what well-respected
independent third parties have said:
- “As a result of the current advisor's investment strategy, TICC has delivered negative [Total
Shareholder Return] and underperformed peers and the index over the past five years . . . As such, terminating the current
advisor appears to be in the best interest of TICC shareholders.”
– ISS proxy advisory report, Aug. 17, 2016
- “[W]e believe that voting FOR the [TSLX] nominee and voting FOR the termination of the investment
advisory agreement is in the best interest of the Company and its shareholders. In arriving at that conclusion, we have
considered the following factors: 1. Our belief that the [e]xisting [a]dviser’s investment strategy did not work on the benefit
of the Company and its stockholders. 2. We believe that [TSLX] would work on offering an opportunity to the Company to be under a
reputable external adviser with a reasonable amount of investment adviser fees to protect and maximize stockholder value.”
– Egan-Jones proxy advisory report, Aug. 23, 2016
- “The overriding fact facing shareholders is that the board failed to take action while overseeing
five years of TICC underperformance, which by itself signals that change is needed at the board level. Moreover, the long tenure
of this board, with each of its five members having served for 13 years as directors, suggests that the company should welcome
fresh perspectives to the board. As such, there seems to be a compelling case that change is warranted at this time.
– ISS proxy advisory report, Aug. 17, 2016
- “[W]e consider the appointment of Mr. Millet affords important benefits above and beyond his
financial expertise, most notably with respect to his ability to immediately inject a fresh, outside perspective and a
willingness to thoughtfully evaluate TICC's present circumstances . . . [W]e consider the election of Mr. Millet represents a
more favorable outcome for unaffiliated investors by a wide margin.”
– Glass Lewis proxy advisory report, Aug. 19, 2016
We continue to be very disappointed in your repeated and continued assertions that we have not articulated a plan and that
terminating the existing investment advisory agreement could result in TICC being left with no investment adviser, no management
team and no operational infrastructure. As ISS correctly pointed out, this risk “appears to be utterly within the board's control …
literally by identifying a new advisor.” In ISS’s words, “[t]o the extent shareholders have a risk here, … it would appear the root
cause of the risk would be the current director's unwillingness to fulfil [sic] their responsibilities to shareholders by taking
any action at all.”
We find it wholly inappropriate for you, the independent directors, to argue that your stockholders should vote against change
because that change may present the risk that TICC’s independent directors will fail to act in accordance with their fiduciary
duties. If you are saying that you are unable or unwilling to fulfill your duties to stockholders, we
respectfully request that you resign.
As a long-term participant in the BDC space, we have an interest in seeing that TICC and other BDCs employ best-in-class
corporate governance principles, provide stockholders with real transparency, and deliver strong results for stockholders,
including through sound capital allocation and active management. Therefore, we hope that our efforts to date, on behalf of all
TICC stockholders, will lead you to genuinely re-examine the Company’s practices so that stockholders have the opportunity to
benefit from the changes they need and deserve.
| Respectfully, |
| |
| TPG SPECIALTY LENDING, INC. |
| |
| Joshua Easterly |
| Chairman and Co-Chief Executive Officer |
| |
| Michael Fishman |
| Co-Chief Executive Officer |
| |
Appendix A: GAAP Net Investment Income Bridge (Q2 2016 versus Q1 2016)15
See multimedia carousel for chart.
Appendix B: TICC CLO Equity Portfolio – Performance Statistics16,17
| |
|
|
|
|
|
|
|
|
|
|
|
|
|
|
|
|
|
|
|
|
| CLO Equity Position |
|
Principal18
|
|
Cost18 |
|
Fair Value18 |
|
Q2
2015
|
|
Q3
2015
|
|
Q4
2015
|
|
Q1
2016
|
|
Q2
2016
|
|
%∆
Q/Q
|
|
%∆
Y/Y
|
|
|
|
|
|
|
|
|
|
|
|
|
|
|
|
|
|
|
|
|
|
| ACAS CLO 2012- 1, Ltd. |
|
$6,000,000 |
|
$2,197,157 |
|
$2,460,000 |
|
|
|
|
|
|
|
|
|
|
|
|
|
|
|
Cash-on-Cash Distribution19
|
|
|
|
|
|
|
|
4.7% |
|
3.7% |
|
4.0% |
|
3.3% |
|
2.8% |
|
(15.1%) |
|
(40.1%) |
|
Junior Overcollateralization Cushion20
|
|
|
|
|
|
|
|
5.6% |
|
5.6% |
|
5.6% |
|
4.5% |
|
4.0% |
|
(10.6%) |
|
(27.6%) |
|
|
|
|
|
|
|
|
|
|
|
|
|
|
|
|
|
|
|
|
|
| ALM X, Ltd. |
|
$3,801,000 |
|
$2,587,735 |
|
$2,593,317 |
|
|
|
|
|
|
|
|
|
|
|
|
|
|
| Cash-on-Cash Distribution |
|
|
|
|
|
|
|
6.9% |
|
7.6% |
|
7.2% |
|
6.9% |
|
6.4% |
|
(8.5%) |
|
(8.1%) |
| Junior Overcollateralization Cushion |
|
|
|
|
|
|
|
4.1% |
|
3.8% |
|
3.8% |
|
3.3% |
|
3.3% |
|
(1.7%) |
|
(20.6%) |
|
|
|
|
|
|
|
|
|
|
|
|
|
|
|
|
|
|
|
|
|
| ALM XII, Ltd. |
|
$2,825,000 |
|
$2,451,703 |
|
$2,401,250 |
|
|
|
|
|
|
|
|
|
|
|
|
|
|
| Cash-on-Cash Distribution |
|
|
|
|
|
|
|
n/a |
|
5.4% |
|
5.5% |
|
6.4% |
|
5.6% |
|
(12.6%) |
|
n/a |
| Junior Overcollateralization Cushion |
|
|
|
|
|
|
|
4.2% |
|
4.2% |
|
4.3% |
|
4.3% |
|
4.0% |
|
(6.9%) |
|
(4.1%) |
|
|
|
|
|
|
|
|
|
|
|
|
|
|
|
|
|
|
|
|
|
| AMMC CLO XI, Ltd. |
|
$6,000,000 |
|
$3,340,013 |
|
$2,640,000 |
|
|
|
|
|
|
|
|
|
|
|
|
|
|
| Cash-on-Cash Distribution |
|
|
|
|
|
|
|
3.9% |
|
4.1% |
|
4.0% |
|
3.9% |
|
3.4% |
|
(13.6%) |
|
(13.9%) |
| Junior Overcollateralization Cushion |
|
|
|
|
|
|
|
4.2% |
|
3.9% |
|
3.9% |
|
3.7% |
|
4.5% |
|
21.1% |
|
7.2% |
|
|
|
|
|
|
|
|
|
|
|
|
|
|
|
|
|
|
|
|
|
| AMMC CLO XII, Ltd. |
|
$12,921,429 |
|
$7,872,678 |
|
$6,202,286 |
|
|
|
|
|
|
|
|
|
|
|
|
|
|
| Cash-on-Cash Distribution |
|
|
|
|
|
|
|
5.2% |
|
5.2% |
|
5.0% |
|
6.5% |
|
2.8% |
|
(56.9%) |
|
(46.0%) |
| Junior Overcollateralization Cushion |
|
|
|
|
|
|
|
5.1% |
|
4.5% |
|
4.6% |
|
4.5% |
|
4.5% |
|
1.5% |
|
(10.5%) |
|
|
|
|
|
|
|
|
|
|
|
|
|
|
|
|
|
|
|
|
|
| Ares XXV CLO Ltd. |
|
$15,500,000 |
|
$10,294,819 |
|
$6,820,000 |
|
|
|
|
|
|
|
|
|
|
|
|
|
|
| Cash-on-Cash Distribution |
|
|
|
|
|
|
|
4.1% |
|
3.8% |
|
3.4% |
|
3.6% |
|
2.8% |
|
(20.9%) |
|
(30.7%) |
| Junior Overcollateralization Cushion |
|
|
|
|
|
|
|
4.1% |
|
3.6% |
|
3.5% |
|
3.3% |
|
2.7% |
|
(19.0%) |
|
(34.6%) |
|
|
|
|
|
|
|
|
|
|
|
|
|
|
|
|
|
|
|
|
|
| Ares XXVI CLO Ltd. |
|
$10,500,000 |
|
$6,708,840 |
|
$4,258,249 |
|
|
|
|
|
|
|
|
|
|
|
|
|
|
| Cash-on-Cash Distribution |
|
|
|
|
|
|
|
5.2% |
|
5.0% |
|
4.4% |
|
4.7% |
|
3.8% |
|
(18.5%) |
|
(25.9%) |
| Junior Overcollateralization Cushion |
|
|
|
|
|
|
|
3.9% |
|
3.5% |
|
3.4% |
|
3.0% |
|
2.5% |
|
(18.6%) |
|
(37.0%) |
|
|
|
|
|
|
|
|
|
|
|
|
|
|
|
|
|
|
|
|
|
| Ares XXIX CLO Ltd. |
|
$12,750,000 |
|
$9,409,679 |
|
$6,240,823 |
|
|
|
|
|
|
|
|
|
|
|
|
|
|
| Cash-on-Cash Distribution |
|
|
|
|
|
|
|
5.8% |
|
4.9% |
|
4.6% |
|
4.5% |
|
3.9% |
|
(13.7%) |
|
(31.8%) |
| Junior Overcollateralization Cushion |
|
|
|
|
|
|
|
3.7% |
|
3.3% |
|
3.2% |
|
3.0% |
|
2.4% |
|
(21.5%) |
|
(36.2%) |
|
|
|
|
|
|
|
|
|
|
|
|
|
|
|
|
|
|
|
|
|
| Benefit Street Partners CLO II, Ltd. |
|
$23,450,000 |
|
$20,967,353 |
|
$14,299,564 |
|
|
|
|
|
|
|
|
|
|
|
|
|
|
| Cash-on-Cash Distribution |
|
|
|
|
|
|
|
5.6% |
|
7.5% |
|
6.4% |
|
6.4% |
|
5.1% |
|
(19.9%) |
|
(9.0%) |
| Junior Overcollateralization Cushion |
|
|
|
|
|
|
|
4.4% |
|
4.5% |
|
4.6% |
|
4.5% |
|
3.3% |
|
(27.0%) |
|
(26.2%) |
|
|
|
|
|
|
|
|
|
|
|
|
|
|
|
|
|
|
|
|
|
| Carlyle GMS CLO 2013- 2, Ltd. |
|
$10,125,000 |
|
$7,030,284 |
|
$5,886,917 |
|
|
|
|
|
|
|
|
|
|
|
|
|
|
| Cash-on-Cash Distribution |
|
|
|
|
|
|
|
6.1% |
|
7.0% |
|
5.6% |
|
6.4% |
|
5.5% |
|
(14.3%) |
|
(9.5%) |
| Junior Overcollateralization Cushion |
|
|
|
|
|
|
|
5.1% |
|
5.1% |
|
5.1% |
|
4.7% |
|
4.7% |
|
– |
|
(6.7%) |
|
|
|
|
|
|
|
|
|
|
|
|
|
|
|
|
|
|
|
|
|
| Carlyle GMS CLO 2014- 4, Ltd. |
|
$25,784,000 |
|
$18,404,728 |
|
$18,003,917 |
|
|
|
|
|
|
|
|
|
|
|
|
|
|
| Cash-on-Cash Distribution |
|
|
|
|
|
|
|
11.7% |
|
5.6% |
|
4.6% |
|
5.2% |
|
4.2% |
|
(18.1%) |
|
(64.0%) |
| Junior Overcollateralization Cushion |
|
|
|
|
|
|
|
4.4% |
|
4.5% |
|
4.6% |
|
4.3% |
|
4.5% |
|
4.7% |
|
3.3% |
|
|
|
|
|
|
|
|
|
|
|
|
|
|
|
|
|
|
|
|
|
| Catamaran CLO 2012- 1 Ltd. |
|
$23,000,000 |
|
$12,971,150 |
|
$4,140,000 |
|
|
|
|
|
|
|
|
|
|
|
|
|
|
| Cash-on-Cash Distribution |
|
|
|
|
|
|
|
4.5% |
|
4.8% |
|
4.6% |
|
3.8% |
|
4.0% |
|
4.7% |
|
(12.8%) |
| Junior Overcollateralization Cushion |
|
|
|
|
|
|
|
4.8% |
|
4.8% |
|
3.5% |
|
2.4% |
|
2.7% |
|
13.3% |
|
(44.1%) |
|
|
|
|
|
|
|
|
|
|
|
|
|
|
|
|
|
|
|
|
|
| Catamaran CLO 2013- 1 Ltd. |
|
$14,700,000 |
|
$9,638,879 |
|
$7,497,000 |
|
|
|
|
|
|
|
|
|
|
|
|
|
|
| Cash-on-Cash Distribution |
|
|
|
|
|
|
|
6.2% |
|
5.9% |
|
5.7% |
|
5.3% |
|
5.4% |
|
0.7% |
|
(13.4%) |
| Junior Overcollateralization Cushion |
|
|
|
|
|
|
|
4.9% |
|
4.9% |
|
3.8% |
|
4.6% |
|
4.7% |
|
1.2% |
|
(4.1%) |
|
|
|
|
|
|
|
|
|
|
|
|
|
|
|
|
|
|
|
|
|
| Cedar Funding II CLO, Ltd. |
|
$18,750,000 |
|
$14,070,499 |
|
$12,187,500 |
|
|
|
|
|
|
|
|
|
|
|
|
|
|
| Cash-on-Cash Distribution |
|
|
|
|
|
|
|
4.3% |
|
3.3% |
|
3.7% |
|
3.5% |
|
3.3% |
|
(4.8%) |
|
(22.9%) |
| Junior Overcollateralization Cushion |
|
|
|
|
|
|
|
5.2% |
|
5.2% |
|
4.9% |
|
4.4% |
|
4.5% |
|
2.0% |
|
(14.1%) |
|
|
|
|
|
|
|
|
|
|
|
|
|
|
|
|
|
|
|
|
|
| CIFC Funding 2012- 1, Ltd. |
|
$12,750,000 |
|
$7,303,328 |
|
$4,717,500 |
|
|
|
|
|
|
|
|
|
|
|
|
|
|
| Cash-on-Cash Distribution |
|
|
|
|
|
|
|
6.3% |
|
5.4% |
|
5.2% |
|
5.1% |
|
5.2% |
|
1.2% |
|
(18.2%) |
| Junior Overcollateralization Cushion |
|
|
|
|
|
|
|
5.2% |
|
5.2% |
|
4.8% |
|
4.8% |
|
4.6% |
|
(4.9%) |
|
(11.8%) |
|
|
|
|
|
|
|
|
|
|
|
|
|
|
|
|
|
|
|
|
|
| FINN Square CLO, Ltd. |
|
$5,500,000 |
|
$2,206,069 |
|
$2,310,000 |
|
|
|
|
|
|
|
|
|
|
|
|
|
|
| Cash-on-Cash Distribution |
|
|
|
|
|
|
|
5.2% |
|
4.4% |
|
4.9% |
|
4.1% |
|
4.1% |
|
(0.0%) |
|
(19.8%) |
| Junior Overcollateralization Cushion |
|
|
|
|
|
|
|
4.6% |
|
4.7% |
|
4.7% |
|
3.8% |
|
2.9% |
|
(23.8%) |
|
(37.3%) |
|
|
|
|
|
|
|
|
|
|
|
|
|
|
|
|
|
|
|
|
|
| GoldenTree Loan Opportunities VII |
|
$4,670,000 |
|
$2,977,127 |
|
$3,128,900 |
|
|
|
|
|
|
|
|
|
|
|
|
|
|
| Cash-on-Cash Distribution |
|
|
|
|
|
|
|
6.7% |
|
6.3% |
|
6.5% |
|
6.4% |
|
5.4% |
|
(15.9%) |
|
(19.8%) |
| Junior Overcollateralization Cushion |
|
|
|
|
|
|
|
5.1% |
|
4.9% |
|
4.7% |
|
3.7% |
|
4.4% |
|
18.2% |
|
(14.8%) |
|
|
|
|
|
|
|
|
|
|
|
|
|
|
|
|
|
|
|
|
|
| Halcyon Loan Advisors Funding 2014- 2 |
|
$8,000,000 |
|
$5,598,450 |
|
$3,860,000 |
|
|
|
|
|
|
|
|
|
|
|
|
|
|
| Cash-on-Cash Distribution |
|
|
|
|
|
|
|
7.0% |
|
6.1% |
|
6.4% |
|
6.6% |
|
5.6% |
|
(14.8%) |
|
(20.1%) |
| Junior Overcollateralization Cushion |
|
|
|
|
|
|
|
5.1% |
|
5.4% |
|
4.6% |
|
3.5% |
|
2.5% |
|
(29.1%) |
|
(51.6%) |
|
|
|
|
|
|
|
|
|
|
|
|
|
|
|
|
|
|
|
|
|
| Hull Street CLO Ltd. |
|
$5,000,000 |
|
$3,592,246 |
|
$2,100,000 |
|
|
|
|
|
|
|
|
|
|
|
|
|
|
| Cash-on-Cash Distribution |
|
|
|
|
|
|
|
8.5% |
|
7.7% |
|
6.8% |
|
6.2% |
|
5.0% |
|
(19.2%) |
|
(40.7%) |
| Junior Overcollateralization Cushion |
|
|
|
|
|
|
|
4.6% |
|
4.6% |
|
3.9% |
|
2.4% |
|
2.5% |
|
1.6% |
|
(46.6%) |
| |
|
|
|
|
|
|
|
|
|
|
|
|
|
|
|
|
|
|
|
|
| CLO Equity Position |
|
Principal21
|
|
Cost4 |
|
Fair Value4 |
|
Q2
2015
|
|
Q3
2015
|
|
Q4
2015
|
|
Q1
2016
|
|
Q2
2016
|
|
%∆
Q/Q
|
|
%∆
Y/Y
|
|
|
|
|
|
|
|
|
|
|
|
|
|
|
|
|
|
|
|
|
|
| Ivy Hill Middle Market Credit Fund VII |
|
$14,000,000 |
|
$11,896,222 |
|
$10,173,989 |
|
|
|
|
|
|
|
|
|
|
|
|
|
|
| Cash-on-Cash Distribution |
|
|
|
|
|
|
|
5.1% |
|
5.1% |
|
4.8% |
|
5.3% |
|
4.8% |
|
(8.4%) |
|
(4.8%) |
| Junior Overcollateralization Cushion |
|
|
|
|
|
|
|
4.9% |
|
5.0% |
|
5.1% |
|
5.0% |
|
5.1% |
|
1.5% |
|
4.3% |
|
|
|
|
|
|
|
|
|
|
|
|
|
|
|
|
|
|
|
|
|
| Jamestown CLO V Ltd. |
|
$8,000,000 |
|
$5,476,339 |
|
$2,880,000 |
|
|
|
|
|
|
|
|
|
|
|
|
|
|
| Cash-on-Cash Distribution |
|
|
|
|
|
|
|
n/a |
|
11.9% |
|
4.8% |
|
4.9% |
|
4.2% |
|
(15.5%) |
|
n/a |
| Junior Overcollateralization Cushion |
|
|
|
|
|
|
|
4.0% |
|
1.8% |
|
1.6% |
|
1.5% |
|
1.2% |
|
(22.8%) |
|
(70.5%) |
|
|
|
|
|
|
|
|
|
|
|
|
|
|
|
|
|
|
|
|
|
| KVK CLO 2013- 2, Ltd. |
|
$5,000,000 |
|
$1,834,437 |
|
$1,950,000 |
|
|
|
|
|
|
|
|
|
|
|
|
|
|
| Cash-on-Cash Distribution |
|
|
|
|
|
|
|
5.3% |
|
5.6% |
|
5.0% |
|
5.5% |
|
4.3% |
|
(21.1%) |
|
(18.4%) |
| Junior Overcollateralization Cushion |
|
|
|
|
|
|
|
3.8% |
|
3.5% |
|
3.3% |
|
3.1% |
|
3.3% |
|
5.0% |
|
(14.7%) |
|
|
|
|
|
|
|
|
|
|
|
|
|
|
|
|
|
|
|
|
|
| Madison Park Funding XIX, Ltd. |
|
$5,422,500 |
|
$6,373,537 |
|
$6,398,550 |
|
|
|
|
|
|
|
|
|
|
|
|
|
|
| Cash-on-Cash Distribution |
|
|
|
|
|
|
|
n/a |
|
n/a |
|
n/a |
|
n/a |
|
n/a |
|
n/a |
|
n/a |
| Junior Overcollateralization Cushion |
|
|
|
|
|
|
|
n/a |
|
n/a |
|
3.8% |
|
5.6% |
|
6.0% |
|
7.2% |
|
n/a |
|
|
|
|
|
|
|
|
|
|
|
|
|
|
|
|
|
|
|
|
|
| Marea CLO, Ltd. |
|
$16,217,000 |
|
$10,618,808 |
|
$5,647,012 |
|
|
|
|
|
|
|
|
|
|
|
|
|
|
| Cash-on-Cash Distribution |
|
|
|
|
|
|
|
4.6% |
|
3.1% |
|
4.1% |
|
4.1% |
|
3.3% |
|
(20.7%) |
|
(29.2%) |
| Junior Overcollateralization Cushion |
|
|
|
|
|
|
|
5.3% |
|
5.0% |
|
3.9% |
|
3.8% |
|
3.6% |
|
(7.1%) |
|
(32.4%) |
|
|
|
|
|
|
|
|
|
|
|
|
|
|
|
|
|
|
|
|
|
| MidOcean Credit CLO IV |
|
$9,500,000 |
|
$7,398,245 |
|
$7,030,000 |
|
|
|
|
|
|
|
|
|
|
|
|
|
|
| Cash-on-Cash Distribution |
|
|
|
|
|
|
|
n/a |
|
n/a |
|
12.4% |
|
6.7% |
|
5.7% |
|
(15.2%) |
|
n/a |
| Junior Overcollateralization Cushion |
|
|
|
|
|
|
|
n/a |
|
4.1% |
|
4.1% |
|
4.1% |
|
4.1% |
|
(1.0%) |
|
n/a |
|
|
|
|
|
|
|
|
|
|
|
|
|
|
|
|
|
|
|
|
|
| Mountain Hawk III CLO |
|
$17,200,000 |
|
$11,155,970 |
|
$5,134,732 |
|
|
|
|
|
|
|
|
|
|
|
|
|
|
| Cash-on-Cash Distribution |
|
|
|
|
|
|
|
4.9% |
|
4.7% |
|
4.8% |
|
4.8% |
|
3.1% |
|
(35.9%) |
|
(37.8%) |
| Junior Overcollateralization Cushion |
|
|
|
|
|
|
|
4.0% |
|
4.0% |
|
3.7% |
|
1.2% |
|
1.6% |
|
42.5% |
|
(59.2%) |
|
|
|
|
|
|
|
|
|
|
|
|
|
|
|
|
|
|
|
|
|
| Mountain Hawk III CLO (M Notes) |
|
$2,389,676 |
|
– |
|
$356,978 |
|
|
|
|
|
|
|
|
|
|
|
|
|
|
| Cash-on-Cash Distribution |
|
|
|
|
|
|
|
1.7% |
|
1.7% |
|
1.7% |
|
1.7% |
|
1.7% |
|
(1.8%) |
|
(0.4%) |
| Junior Overcollateralization Cushion |
|
|
|
|
|
|
|
n/a |
|
n/a |
|
n/a |
|
n/a |
|
n/a |
|
n/a |
|
n/a |
|
|
|
|
|
|
|
|
|
|
|
|
|
|
|
|
|
|
|
|
|
| Neuberger Berman CLO XVI, Ltd. |
|
$2,500,000 |
|
$1,062,818 |
|
$1,075,000 |
|
|
|
|
|
|
|
|
|
|
|
|
|
|
| Cash-on-Cash Distribution |
|
|
|
|
|
|
|
4.1% |
|
4.9% |
|
3.8% |
|
3.9% |
|
3.0% |
|
(22.1%) |
|
(25.7%) |
| Junior Overcollateralization Cushion |
|
|
|
|
|
|
|
3.6% |
|
2.7% |
|
2.7% |
|
2.6% |
|
2.4% |
|
(7.6%) |
|
(33.0%) |
|
|
|
|
|
|
|
|
|
|
|
|
|
|
|
|
|
|
|
|
|
| Newmark Capital Funding 2013- 1 CLO |
|
$20,000,000 |
|
$12,122,114 |
|
$6,600,000 |
|
|
|
|
|
|
|
|
|
|
|
|
|
|
| Cash-on-Cash Distribution |
|
|
|
|
|
|
|
5.7% |
|
4.9% |
|
5.4% |
|
5.2% |
|
4.6% |
|
(13.0%) |
|
(19.9%) |
| Junior Overcollateralization Cushion |
|
|
|
|
|
|
|
3.3% |
|
3.3% |
|
3.1% |
|
2.4% |
|
1.8% |
|
(25.4%) |
|
(46.0%) |
|
|
|
|
|
|
|
|
|
|
|
|
|
|
|
|
|
|
|
|
|
| Shackleton 2013- III CLO, Ltd. |
|
$5,407,500 |
|
$3,959,337 |
|
$2,109,450 |
|
|
|
|
|
|
|
|
|
|
|
|
|
|
| Cash-on-Cash Distribution |
|
|
|
|
|
|
|
6.0% |
|
6.3% |
|
5.8% |
|
6.0% |
|
4.7% |
|
(21.6%) |
|
(21.7%) |
| Junior Overcollateralization Cushion |
|
|
|
|
|
|
|
4.6% |
|
4.6% |
|
4.1% |
|
3.6% |
|
3.3% |
|
(9.8%) |
|
(28.8%) |
|
|
|
|
|
|
|
|
|
|
|
|
|
|
|
|
|
|
|
|
|
| Shackleton 2013- IV CLO, Ltd. |
|
$21,500,000 |
|
$15,940,844 |
|
$8,695,962 |
|
|
|
|
|
|
|
|
|
|
|
|
|
|
| Cash-on-Cash Distribution |
|
|
|
|
|
|
|
6.5% |
|
6.5% |
|
5.7% |
|
5.5% |
|
4.8% |
|
(13.4%) |
|
(25.8%) |
| Junior Overcollateralization Cushion |
|
|
|
|
|
|
|
4.4% |
|
4.5% |
|
4.1% |
|
3.5% |
|
3.3% |
|
(6.2%) |
|
(25.6%) |
|
|
|
|
|
|
|
|
|
|
|
|
|
|
|
|
|
|
|
|
|
| Telos CLO 2013- 3, Ltd. |
|
$10,416,666 |
|
$7,681,883 |
|
$4,687,500 |
|
|
|
|
|
|
|
|
|
|
|
|
|
|
| Cash-on-Cash Distribution |
|
|
|
|
|
|
|
6.0% |
|
5.8% |
|
5.8% |
|
5.6% |
|
5.3% |
|
(6.1%) |
|
(12.6%) |
| Junior Overcollateralization Cushion |
|
|
|
|
|
|
|
4.9% |
|
5.0% |
|
5.0% |
|
5.0% |
|
4.3% |
|
(14.0%) |
|
(11.6%) |
|
|
|
|
|
|
|
|
|
|
|
|
|
|
|
|
|
|
|
|
|
| Telos CLO 2013- 4, Ltd. |
|
$11,350,000 |
|
$7,183,572 |
|
$5,536,204 |
|
|
|
|
|
|
|
|
|
|
|
|
|
|
| Cash-on-Cash Distribution |
|
|
|
|
|
|
|
5.4% |
|
5.2% |
|
5.1% |
|
4.9% |
|
6.0% |
|
23.0% |
|
10.3% |
| Junior Overcollateralization Cushion |
|
|
|
|
|
|
|
4.6% |
|
4.7% |
|
4.8% |
|
4.1% |
|
3.4% |
|
(17.6%) |
|
(26.6%) |
|
|
|
|
|
|
|
|
|
|
|
|
|
|
|
|
|
|
|
|
|
| Telos CLO 2014- 5, Ltd. |
|
$10,500,000 |
|
$7,731,246 |
|
$4,664,001 |
|
|
|
|
|
|
|
|
|
|
|
|
|
|
| Cash-on-Cash Distribution |
|
|
|
|
|
|
|
6.3% |
|
5.8% |
|
5.6% |
|
5.6% |
|
5.4% |
|
(4.3%) |
|
(13.9%) |
| Junior Overcollateralization Cushion |
|
|
|
|
|
|
|
4.2% |
|
4.3% |
|
4.4% |
|
4.5% |
|
3.9% |
|
(13.0%) |
|
(6.0%) |
|
|
|
|
|
|
|
|
|
|
|
|
|
|
|
|
|
|
|
|
|
| Venture XV CLO, Ltd. |
|
$5,000,000 |
|
$2,408,824 |
|
$2,600,000 |
|
|
|
|
|
|
|
|
|
|
|
|
|
|
| Cash-on-Cash Distribution |
|
|
|
|
|
|
|
5.3% |
|
6.5% |
|
5.2% |
|
5.1% |
|
4.5% |
|
(12.1%) |
|
(15.0%) |
| Junior Overcollateralization Cushion |
|
|
|
|
|
|
|
4.0% |
|
3.9% |
|
3.6% |
|
2.9% |
|
2.5% |
|
(12.2%) |
|
(36.9%) |
|
|
|
|
|
|
|
|
|
|
|
|
|
|
|
|
|
|
|
|
|
| Windriver 2012- 1 CLO, Ltd. |
|
$7,500,000 |
|
$5,411,574 |
|
$4,576,096 |
|
|
|
|
|
|
|
|
|
|
|
|
|
|
| Cash-on-Cash Distribution |
|
|
|
|
|
|
|
4.8% |
|
5.6% |
|
4.4% |
|
5.0% |
|
4.1% |
|
(17.1%) |
|
(13.6%) |
| Junior Overcollateralization Cushion |
|
|
|
|
|
|
|
5.0% |
|
5.1% |
|
4.4% |
|
5.2% |
|
5.2% |
|
1.7% |
|
4.0% |
|
|
|
|
|
|
|
|
|
|
|
|
|
|
|
|
|
|
|
|
|
| York CLO- 1, Ltd. |
|
$7,000,000 |
|
$5,167,978 |
|
$5,250,000 |
|
|
|
|
|
|
|
|
|
|
|
|
|
|
| Cash-on-Cash Distribution |
|
|
|
|
|
|
|
n/a |
|
10.9% |
|
7.2% |
|
4.6% |
|
3.8% |
|
(16.2%) |
|
n/a |
| Junior Overcollateralization Cushion |
|
|
|
|
|
|
|
4.8% |
|
4.9% |
|
4.4% |
|
4.0% |
|
4.5% |
|
12.4% |
|
(5.6%) |
|
|
|
|
|
|
|
|
|
|
|
|
|
|
|
|
|
|
|
|
|
| Totals / Fair Value-Weighted Average |
|
|
|
|
|
|
|
|
|
|
|
|
|
|
|
|
|
|
|
|
| Balances |
|
$400,929,771 |
|
$273,046,485 |
|
$197,112,697 |
|
|
|
|
|
|
|
|
|
|
|
|
|
|
|
Cash-on-Cash Distributions22
|
|
|
|
|
|
|
|
6.1% |
|
5.7% |
|
5.4% |
|
5.2% |
|
4.4% |
|
(14.4%) |
|
(27.2%) |
|
Junior Overcollateralization Cushion5
|
|
|
|
|
|
|
|
4.6% |
|
4.5% |
|
4.2% |
|
4.0% |
|
3.8% |
|
(4.8%) |
|
(17.2%) |
|
|
|
|
|
|
|
|
|
|
|
|
|
|
|
|
|
|
|
|
|
|
|
|
|
|
|
|
|
|
|
|
|
Cash-on-cash distributions and junior
overcollateralization cushions decreased
meaningfully on a Q/Q and Y/Y basis in Q2 2016
|
|
|
|
|
|
|
|
|
|
|
|
|
|
Appendix C: TICC CLO Equity Portfolio – Effective Yield Comparison23
| Effective Yield Comparison - Q2 2016 versus Q1 2016 |
|
|
|
|
|
|
|
|
|
|
|
|
|
|
|
|
|
|
|
|
|
|
|
|
|
|
|
|
|
|
|
|
|
At 6/30/16 |
|
Effective Yield |
| # |
|
Investment |
|
|
|
Principal
($MM) |
|
Cost
($MM) |
|
Fair Value
($MM) |
|
Jun-16 |
|
Mar-16 |
|
Difference
(% Points)
|
|
CLO Equity Positions Held in Both Q2 2016 and Q1 2016
|
|
|
|
|
|
|
|
|
|
|
|
| 1 |
|
AMMC CLO XI, Ltd. |
|
|
|
$6.0 |
|
$3.3 |
|
$2.6 |
|
24.66% |
|
22.46% |
|
2.20% |
| 2 |
|
AMMC CLO XII, Ltd. |
|
|
|
$12.9 |
|
$7.9 |
|
$6.2 |
|
17.75% |
|
13.70% |
|
4.05% |
| 3 |
|
Ares XXV CLO Ltd. |
|
|
|
$15.5 |
|
$10.3 |
|
$6.8 |
|
4.28% |
|
2.88% |
|
1.40% |
| 4 |
|
Ares XXVI CLO Ltd. |
|
|
|
$10.5 |
|
$6.7 |
|
$4.3 |
|
5.10% |
|
3.71% |
|
1.39% |
| 5 |
|
Ares XXIX CLO Ltd. |
|
|
|
$12.8 |
|
$9.4 |
|
$6.2 |
|
9.13% |
|
5.63% |
|
3.50% |
| 6 |
|
Benefit Street Partners CLO II, Ltd. |
|
|
|
$23.5 |
|
$21.0 |
|
$14.3 |
|
14.50% |
|
15.85% |
|
(1.35%) |
| 7 |
|
Carlyle Global Market Strategies CLO 2013- 2, Ltd. |
|
|
|
$10.1 |
|
$7.0 |
|
$5.9 |
|
16.78% |
|
22.35% |
|
(5.57%) |
| 8 |
|
Carlyle Global Market Strategies CLO 2014- 4, Ltd. |
|
|
|
$25.8 |
|
$18.4 |
|
$18.0 |
|
17.36% |
|
19.12% |
|
(1.76%) |
| 9 |
|
Catamaran CLO 2012- 1 Ltd. |
|
|
|
$23.0 |
|
$13.0 |
|
$4.1 |
|
(14.41%) |
|
(23.25%) |
|
8.84% |
| 10 |
|
Catamaran CLO 2013- 1 Ltd. |
|
|
|
$14.7 |
|
$9.6 |
|
$7.5 |
|
15.41% |
|
8.71% |
|
6.70% |
| 11 |
|
Cedar Funding II CLO, Ltd. |
|
|
|
$18.8 |
|
$14.1 |
|
$12.2 |
|
15.53% |
|
10.49% |
|
5.04% |
| 12 |
|
CIFC Funding 2012- 1, Ltd. |
|
|
|
$12.8 |
|
$7.3 |
|
$4.7 |
|
21.53% |
|
11.32% |
|
10.21% |
| 13 |
|
Halcyon Loan Advisors Funding 2014- 2 Ltd. |
|
|
|
$8.0 |
|
$5.6 |
|
$3.9 |
|
12.08% |
|
4.87% |
|
7.21% |
| 14 |
|
Hull Street CLO Ltd. |
|
|
|
$5.0 |
|
$3.6 |
|
$2.1 |
|
10.51% |
|
5.06% |
|
5.45% |
| 15 |
|
Ivy Hill Middle Market Credit Fund VII, Ltd. |
|
|
|
$14.0 |
|
$11.9 |
|
$10.2 |
|
16.87% |
|
13.79% |
|
3.08% |
| 16 |
|
Jamestown CLO V Ltd. |
|
|
|
$8.0 |
|
$5.5 |
|
$2.9 |
|
7.70% |
|
4.02% |
|
3.68% |
| 17 |
|
Marea CLO, Ltd. |
|
|
|
$16.2 |
|
$10.6 |
|
$5.6 |
|
(0.36%) |
|
(6.72%) |
|
6.36% |
| 18 |
|
MidOcean Credit CLO IV |
|
|
|
$9.5 |
|
$7.4 |
|
$7.0 |
|
19.69% |
|
20.01% |
|
(0.32%) |
| 19 |
|
Mountain Hawk III CLO, Ltd. |
|
|
|
$17.2 |
|
$11.2 |
|
$5.1 |
|
(2.13%) |
|
2.74% |
|
(4.87%) |
| 20 |
|
Newmark Capital Funding 2013-1 CLO Ltd. |
|
|
|
$20.0 |
|
$12.1 |
|
$6.6 |
|
2.08% |
|
2.96% |
|
(0.88%) |
| 21 |
|
Shackleton 2013- III CLO, Ltd. |
|
|
|
$5.4 |
|
$4.0 |
|
$2.1 |
|
2.03% |
|
1.93% |
|
0.10% |
| 22 |
|
Shackleton 2013- IV CLO, Ltd. |
|
|
|
$21.5 |
|
$15.9 |
|
$8.7 |
|
5.41% |
|
6.50% |
|
(1.09%) |
| 23 |
|
Telos CLO 2013- 3, Ltd. |
|
|
|
$10.4 |
|
$7.7 |
|
$4.7 |
|
18.03% |
|
13.85% |
|
4.18% |
| 24 |
|
Telos CLO 2013- 4, Ltd. |
|
|
|
$11.4 |
|
$7.2 |
|
$5.5 |
|
28.93% |
|
22.82% |
|
6.11% |
| 25 |
|
Telos CLO 2014- 5, Ltd. |
|
|
|
$10.5 |
|
$7.7 |
|
$4.7 |
|
19.46% |
|
16.32% |
|
3.14% |
| 26 |
|
Windriver 2012- 1 CLO, Ltd. |
|
|
|
$7.5 |
|
$5.4 |
|
$4.6 |
|
22.46% |
|
20.86% |
|
1.60% |
| Total / Cost-Weighted Average |
|
|
|
$350.8 |
|
$243.8 |
|
$166.6 |
|
10.9% |
|
8.8% |
|
|
|
|
|
|
|
|
|
|
|
|
|
|
|
|
TICC increased the
effective yield at which
it recognized GAAP
revenue from existing
CLO equity
investments by 24.8%
versus Q1 2016
|
|
|
|
CLO Equity Positions Added in Q2 2016
|
|
|
|
|
|
|
|
|
|
|
|
|
|
|
| 27 |
|
ACAS CLO 2012- 1, Ltd. |
|
|
|
$6.0 |
|
$2.2 |
|
$2.5 |
|
58.76% |
|
|
|
|
| 28 |
|
ALM X, Ltd. |
|
|
|
$3.8 |
|
$2.6 |
|
$2.6 |
|
21.78% |
|
|
|
|
| 29 |
|
ALM XII, Ltd. |
|
|
|
$2.8 |
|
$2.5 |
|
$2.4 |
|
18.99% |
|
|
|
|
| 30 |
|
FINN Square CLO, Ltd. |
|
|
|
$5.5 |
|
$2.2 |
|
$2.3 |
|
26.31% |
|
|
|
|
| 31 |
|
GoldenTree Loan Opportunities VII, Ltd. |
|
|
|
$4.7 |
|
$3.0 |
|
$3.1 |
|
19.81% |
|
|
|
|
| 32 |
|
KVK CLO 2013- 2, Ltd. |
|
|
|
$5.0 |
|
$1.8 |
|
$2.0 |
|
43.57% |
|
|
|
|
| 33 |
|
Madison Park Funding XIX, Ltd. |
|
|
|
$5.4 |
|
$6.4 |
|
$6.4 |
|
15.80% |
|
|
|
|
| 34 |
|
Neuberger Berman CLO XVI, Ltd. |
|
|
|
$2.5 |
|
$1.1 |
|
$1.1 |
|
31.82% |
|
|
|
|
| 35 |
|
Venture XV CLO, Ltd. |
|
|
|
$5.0 |
|
$2.4 |
|
$2.6 |
|
28.63% |
|
|
|
|
| 36 |
|
York CLO- 1, Ltd. |
|
|
|
$7.0 |
|
$5.2 |
|
$5.3 |
|
18.01% |
|
|
|
|
| Total / Cost-Weighted Average |
|
|
|
$47.7 |
|
$29.3 |
|
$30.2 |
|
24.8% |
|
|
|
|
| |
|
|
|
|
|
|
|
|
|
|
|
|
|
|
|
|
| Total / Cost-Weighted Average |
|
|
|
$398.5 |
|
$273.0 |
|
$196.8 |
|
12.4% |
|
|
|
|
|
|
|
|
|
|
|
|
|
|
|
|
|
|
|
Appendix D: TICC Long-Term Underperformance
See multimedia carousel for chart.
| |
|
|
|
|
|
|
|
|
|
|
|
|
|
|
|
|
|
|
|
|
|
|
|
|
TICC Relative Performance |
|
Total Return (%)24
|
|
YTD |
|
1Y |
|
3Y |
|
Since
IPO 25
|
|
Since IPO
Annualized22
|
|
YTD |
|
1Y |
|
3Y |
|
Since IPO22 |
|
Since IPO
Annualized22
|
| TICC |
|
14.7% |
|
15.7% |
|
1.7% |
|
76.8% |
|
4.6% |
|
- |
|
- |
|
- |
|
- |
|
|
|
BDC Composite 26
|
|
17.5 |
|
16.9 |
|
12.2 |
|
259.7 |
|
10.6 |
|
(2.9)% |
|
(1.2)% |
|
(10.5)% |
|
(182.9)% |
|
(6.0)% |
| S&P 500 |
|
8.6 |
|
13.4 |
|
40.0 |
|
175.0 |
|
8.2 |
|
6.1% |
|
2.3 % |
|
(38.4)% |
|
(98.3)% |
|
(3.7)% |
| U.S. Treasuries |
|
5.8 |
|
4.8 |
|
13.6 |
|
70.2 |
|
4.3 |
|
8.8% |
|
10.9 % |
|
(12.0)% |
|
6.6% |
|
0.3% |
| Investment Grade Debt |
|
11.4 |
|
10.9 |
|
24.3 |
|
106.1 |
|
5.8 |
|
3.3% |
|
4.8 % |
|
(22.6)% |
|
(29.4)% |
|
(1.3)% |
| High Yield Debt |
|
13.1 |
|
8.3 |
|
15.1 |
|
120.8 |
|
6.4 |
|
1.6% |
|
7.4 % |
|
(13.4)% |
|
(44.0)% |
|
(1.8)% |
|
|
|
|
|
|
|
|
|
|
|
|
|
|
|
|
|
|
|
|
|
| |
|
|
|
|
|
Note: Market data as of August 23, 2016
|
|
|
|
|
|
|
Source: Bloomberg, fixed income benchmark data from Markit iBoxx
|
|
|
|
|
|
|
|
Appendix E: TICC Historical Performance
See multimedia carousel for chart.
| Period Beginning November 21st |
| 2003 |
|
2004 |
|
2005 |
|
2006 |
|
2007 |
|
2008 |
|
2009 |
|
2010 |
|
2011 |
|
2012 |
|
2013 |
|
2014 |
|
2015 |
| TICC Total Return Greater than BDC Composite |
|
X
|
|
X
|
|
X
|
|
X
|
|
X
|
|
X
|
|
X
|
|
X
|
|
X
|
|
X
|
|
X
|
|
X
|
|
X
|
| |
|
|
| |
|
To date, TICC has underperformed the BDC Composite in 85% of the
periods with start dates beginning each year since IPO. The Board and management are cherry-picking the best performance window
(since 2008) to justify their “long-term” performance. |
| |
|
|
| |
|
|
|
|
|
(1)
|
|
Total return calculation includes share price appreciation and cumulative dividends paid.
|
|
|
|
|
|
|
(2)
|
|
BDC Composite comprised of ACAS, AINV, ARCC, BKCC, FSC, GBDC, HTGC, MAIN, MCC, NMFC, PNNT, PSEC,
SLRC, TCAP, and TCRD
|
|
|
|
|
Note: Market data as of August 23, 2016
|
|
|
|
|
Source: Bloomberg
|
|
|
|
|
|
About TPG Specialty Lending
TPG Specialty Lending, Inc. (“TSLX” or the “Company”) is a specialty finance company focused on lending to middle-market
companies. The Company seeks to generate current income primarily in U.S.-domiciled middle-market companies through direct
originations of senior secured loans and, to a lesser extent, originations of mezzanine loans and investments in corporate bonds
and equity securities. The Company has elected to be regulated as a business development company, or BDC, under the Investment
Company Act of 1940 and the rules and regulations promulgated thereunder. TSLX is externally managed by TSL Advisers, LLC, a
Securities and Exchange Commission registered investment adviser. TSLX leverages the deep investment, sector, and operating
resources of TPG Special Situations Partners, the dedicated special situations and credit platform of TPG, with over $16 billion of
assets under management as of March 31, 2016, and the broader TPG platform, a global private investment firm with over $74 billion
of assets under management as of March 31, 2016. For more information, visit the Company’s website at www.tpgspecialtylending.com.
Forward-Looking Statements
Information set forth herein may contain forward-looking statements, including, but not limited to, statements with regard to
the expected future financial position, results of operations, cash flows, dividends, portfolio, financing plans, business
strategy, budgets, capital expenditures, competitive positions, growth opportunities, plans and objectives of management of TICC
Capital Corp. (“TICC”), statements with regard to the expected future financial position, results of operations, cash flows,
dividends, portfolio, financing plans, business strategy, budgets, capital expenditures, competitive positions, growth
opportunities, plans and objectives of management of TPG Specialty Lending, Inc. (“TSLX”), and statements with regard to TSLX’s
proposed business combination transaction with TICC (including any financing required in connection with a possible transaction and
the benefits, results, effects and timing of a possible transaction). Statements set forth herein concerning the business outlook
or future economic performance, anticipated profitability, revenues, expenses, dividends or other financial items, and product or
services line growth of TSLX, TICC and/or the combined businesses of TSLX and TICC, including, but not limited to, statements
containing words such as “anticipate,” “approximate,” “believe,” “plan,” “estimate,” “expect,” “project,” “could,” “would,”
“should,” “will,” “intend,” “may,” “potential,” “upside” and other similar expressions, together with other statements that are not
historical facts, are forward-looking statements that are estimates reflecting the best judgment of TSLX based upon currently
available information.
Such forward-looking statements are inherently uncertain, and stockholders and other potential investors must recognize that
actual results may differ materially from TSLX’s expectations as a result of a variety of factors including, without limitation,
those discussed below. Such forward-looking statements are based upon TSLX’s current expectations and include known and unknown
risks, uncertainties and other factors, many of which TSLX is unable to predict or control, that may cause TSLX’s plans with
respect to TICC or the actual results or performance of TICC, TSLX or TICC and TSLX on a combined basis to differ materially from
any plans, future results or performance expressed or implied by such forward-looking statements. These statements involve risks,
uncertainties and other factors discussed below and detailed from time to time in TSLX’s filings with the Securities and Exchange
Commission (“SEC”).
Risks and uncertainties related to a possible transaction include, among others, uncertainty as to whether TSLX will further
pursue, enter into or consummate a transaction on the terms set forth in its proposal or on other terms, uncertainty as to whether
TICC’s board of directors will engage in good faith, substantive discussions or negotiations with TSLX concerning its proposal or
any other possible transaction, potential adverse reactions or changes to business relationships resulting from the announcement or
completion of a transaction, uncertainties as to the timing of a transaction, adverse effects on TSLX’s stock price resulting from
the announcement or consummation of a transaction or any failure to complete a transaction, competitive responses to the
announcement or consummation of a transaction, the risk that regulatory or other approvals and any financing required in connection
with the consummation of a transaction are not obtained or are obtained subject to terms and conditions that are not anticipated,
costs and difficulties related to a potential integration of TICC’s businesses and operations with TSLX’s businesses and
operations, the inability to obtain, or delays in obtaining, cost savings and synergies from a transaction, unexpected costs,
liabilities, charges or expenses resulting from a transaction, litigation relating to a transaction, the inability to retain key
personnel, and any changes in general economic and/or industry specific conditions.
In addition to these factors, other factors that may affect TSLX’s plans, results or stock price are set forth in TSLX’s Annual
Report on Form 10-K and in its reports on Forms 10-Q and 8-K.
Many of these factors are beyond TSLX’s control. TSLX cautions investors that any forward-looking statements made by TSLX are
not guarantees of future performance. TSLX disclaims any obligation to update any such factors or to announce publicly the results
of any revisions to any of the forward-looking statements to reflect future events or developments.
Third Party-Sourced Statements and Information
Certain statements and information included herein have been sourced from third parties. TSLX does not make any representations
regarding the accuracy, completeness or timeliness of such third party statements or information. Except as expressly set forth
herein, permission to cite such statements or information has neither been sought nor obtained from such third parties. Any such
statements or information should not be viewed as an indication of support from such third parties for the views expressed herein.
All information in this communication regarding TICC, including its businesses, operations and financial results, was obtained from
public sources. While TSLX has no knowledge that any such information is inaccurate or incomplete, TSLX has not verified any of
that information. TSLX reserves the right to change any of its opinions expressed herein at any time as it deems appropriate. TSLX
disclaims any obligation to update the data, information or opinions contained herein.
Proxy Solicitation Information
In connection with TSLX’s solicitation of proxies for the 2016 annual meeting of TICC stockholders in favor of (a) the election
of TSLX’s nominee to serve as a director of TICC and (b) TSLX’s proposal to terminate the Investment Advisory Agreement, dated as
of July 1, 2011, by and between TICC and TICC Management, LLC, as contemplated by Section 15(a) of the Investment Company Act of
1940, as amended, TSLX filed an amended definitive proxy statement in connection therewith on Schedule 14A with the SEC on July 14,
2016 (the “TSLX Proxy Statement”). TSLX has mailed the TSLX Proxy Statement and accompanying GOLD proxy card to stockholders of
TICC. This communication is not a substitute for the TSLX Proxy Statement.
TSLX STRONGLY ADVISES ALL STOCKHOLDERS OF TICC TO READ THE TSLX PROXY STATEMENT AND THE OTHER PROXY MATERIALS AS THEY BECOME
AVAILABLE BECAUSE THEY CONTAIN IMPORTANT INFORMATION. SUCH TSLX PROXY MATERIALS ARE AND WILL BECOME AVAILABLE AT NO CHARGE ON THE
SEC’S WEB SITE AT HTTP://WWW.SEC.GOV AND ON TSLX’S WEBSITE AT HTTP://WWW.TPGSPECIALTYLENDING.COM. IN ADDITION, TSLX WILL PROVIDE COPIES OF THE TSLX PROXY STATEMENT WITHOUT
CHARGE UPON REQUEST. REQUESTS FOR COPIES SHOULD BE DIRECTED TO TSLX’S PROXY SOLICITOR AT TPG@MACKENZIEPARTNERS.COM.
The participants in the solicitation are TSLX and T. Kelley Millet, and certain of TSLX’s directors and executive officers may
also be deemed to be participants in the solicitation. As of the date hereof, TSLX beneficially owned 1,633,719 shares of common
stock of TICC. As of the date hereof, Mr. Millet did not directly or indirectly beneficially own any shares of common stock of
TICC.
Security holders may obtain information regarding the names, affiliations and interests of TSLX’s directors and executive
officers in TSLX’s Annual Report on Form 10-K for the year ended December 31, 2015, which was filed with the SEC on February 24,
2016, its proxy statement for the 2016 annual meeting of TSLX stockholders, which was filed with the SEC on April 8, 2016, and
certain of its Current Reports on Form 8-K. These documents can be obtained free of charge from the sources indicated above.
Additional information regarding the interests of these participants in the proxy solicitation and a description of their direct
and indirect interests, by security holdings or otherwise, is available in the TSLX Proxy Statement and other relevant materials to
be filed with the SEC (if and when available).
This document shall not constitute an offer to sell, buy or exchange or the solicitation of an offer to sell, buy or exchange
any securities, nor shall there be any sale of securities in any jurisdiction in which such offer, solicitation or sale would be
unlawful prior to registration or qualification under the securities laws of any such jurisdiction. No offering of securities shall
be made except by means of a prospectus meeting the requirements of Section 10 of the Securities Act of 1933, as amended.
1 See Appendix A for further detail
2 Source: TICC Investor Presentation for the quarter ended June 30, 2016, page 4; See Appendix C for further
detail
3 See Appendix C for further detail
4 See Appendix A for further detail
5 Source: TICC Capital Corp. Form 10-Q for the period ended June 30, 2016, page 16; Calculated as $7,327,598 of
realized losses divided by 51,479,409 shares outstanding
6 Source: TICC Capital Corp. Form 10-Q for the period ended June 30, 2016, page 16
7 Source: TICC Capital Corp. Form 10-Q for the period ended March 31, 2016, page 1
8 Source: TICC Capital Corp. Form 10-Q for the period ended June 30, 2016, page 32
9 Source: TICC Capital Corp. Form 10-Q for the period ended June 30, 2016, page 34
10 Source: TICC Capital Corp. Form 10-Q for the period ended June 30, 2016, page 16 and TICC Capital Corp. Form 10-Q
for the period ended March 31, 2016, page 16
11 See Appendix A for further detail
12 BDC Composite comprised of ACAS, AINV, ARCC, BKCC, FSC, GBDC, HTGC, MAIN, MCC, NMFC, PNNT, PSEC, SLRC, TCAP, and
TCRD Note: Market data as of August 23, 2016
13 Source: Net asset value per share has declined from $13.71 at December 31, 2004 to $6.54 at June 30, 2016. TICC
Capital Corp. public filings
14 See Appendix E for further detail
15 Source: TICC Capital Corp. public filings (Form 10-Q for the period ended June 30, 2016, page 16 and Form 10-Q for
the period ended March 31, 2016, page 16)
16 Source: Intex Solutions
17 Excludes Windriver 2012-1 CLO, Ltd. equity side letter investment
18 As of 6/30/16
19 Calculated as the quotient of (i) the amount distributed to the equity tranche in each respective quarter, divided
by (ii) the original balance of the equity tranche
20 Calculated as the quotient of (i) the difference between the actual overcollateralization value and the limit
overcollateralization value, divided by (ii) the limit overcollateralization value
21 As of 6/30/16
22 Excludes investments for which there were no distributions and/or there was no overcollateralization tests in each
respective period
23 Source: TICC Capital Corp. public filings (Form 10-Q for the period ended 6/30/16, pages 4–7 and Form 10-Q for the
period ended 3/31/16, pages 5–7)
24 Total return calculation includes share price appreciation and cumulative dividends paid
25 TICC and benchmark returns indexed to November 21, 2003.
26 BDC Composite comprised of ACAS, AINV, ARCC, BKCC, FSC, GBDC, HTGC, MAIN, MCC, NMFC, PNNT, PSEC, SLRC, TCAP, and
TCRD

Investors
TPG Specialty Lending, Inc.
Lucy Lu, 212-601-4753
llu@tpg.com
or
MacKenzie Partners, Inc.
Charlie Koons, 800-322-2885
tpg@mackenziepartners.com
or
Media
TPG Specialty Lending, Inc.
Luke Barrett, 212-601-4752
lbarrett@tpg.com
or
Abernathy MacGregor
Tom Johnson or Pat Tucker
212-371-5999
tbj@abmac.com / pct@abmac.com
View source version on businesswire.com: http://www.businesswire.com/news/home/20160829005496/en/