This month's jobs report was just about as good as it gets, easily overshadowing uncertainty around looming trade wars and
geopolitical firestorms. News that President Trump will meet with the North Korea leader also offered a bit of relief for the
markets early Friday, but it was really the employment report that drove stocks higher, washing out recent shorts ahead of the
weekend.
Shorts were expecting another stronger than expected wage growth number in the employment data, but wages grew less than
expected. This caused the shorts to cover, which in turn helped lift most sectors higher to end the week. This was a perfect
mini-storm as the wage numbers helped keep treasuries from sliding as well. If you remember, it was the strong wage growth that hit
stocks and bonds last month.
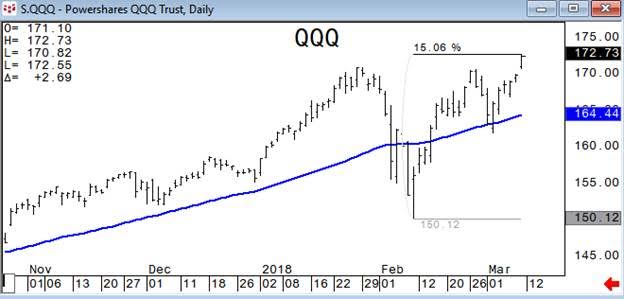
PowerShares QQQ Trust (NASDAQ: QQQ) put
in a new all-time high and was higher for a sixth straight day. That was it’s second such winning streak this year. The first six
days of 2018 were the only other six day advance. The mid-day high was a +15 percent rally off the February 9th low.
China accused U.S. President Donald Trump on Friday of damaging the
global trading system and said it “firmly opposes” Trump’s tariff move.
Japan’s foreign minister echoed that sentiment, saying, “these measures could make a significant impact on economic and
cooperative relationship between Japan and the U.S."
Later, U.S. Treasury Secretary Mnuchin mentioned some other countries could be considered for tariff exemptions over the next
two weeks, although the administration's rhetoric seems to have softened a bit.
Trump will meet with North Korean leader Kim Jong Un in a few weeks, which will make for great television, but could also be an
apocalyptic disaster. How will Trump act towards the ‘Little Rocket Man’ as he has called the North Korean Leader, who has long
been considered as a ruthless dictator who can’t be trusted?
You know President Trump will not be able to stay on script. He will want North Korea to commit to denuclearization, but N.K.
wants to be treated as an equal on the geopolitical stage. But what happens if North Korea strikes a deal that China likes, but
Trump doesn't? Any way you look at it, there is a strong possibility that this will not end well.
The last two times North Korea has made commitments to denuke it renegged. If you're looking to brush up on your US/DPRK
relations history, check out this this article from CNBC.
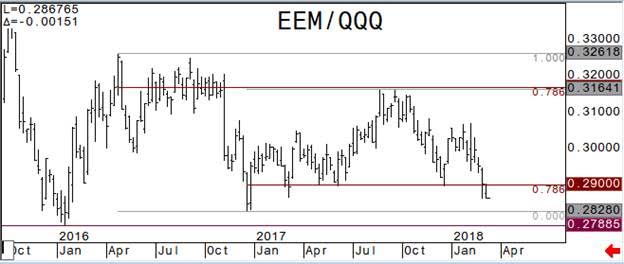
Emerging Markets have been a fund favorite, but you would have done better being long QQQ this year. iShares MSCI
Emerging Markets Indx (NYSE: EEM) relative to QQQ is
below the .786 retracement support which held in mid-December and may see the 2016 (and all-time) lows.
Americans’ equity holdings climbed more than they have in any quarter for four years over Q4 2017, bringing stock holdings to
$17.9 trillion, or 22.2 percent of all financial assets. This is the highest share percentage since
2000 amid the technology bubble.
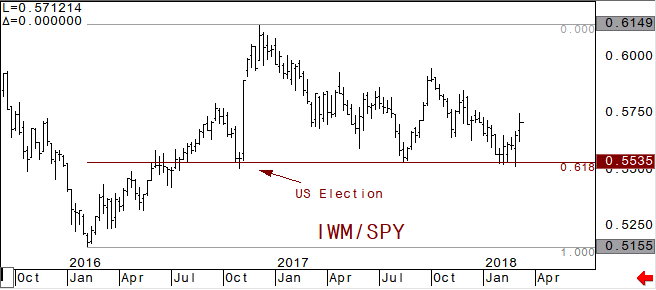
Is Rotation Back? There has been some rotation since the February lows, and this is a positive for the market. Small caps have
been outperforming which has been good for the overall market tone. Flows into small caps is saying that money is not moving into
safety trades. Trade war seems to be benefiting the small caps.
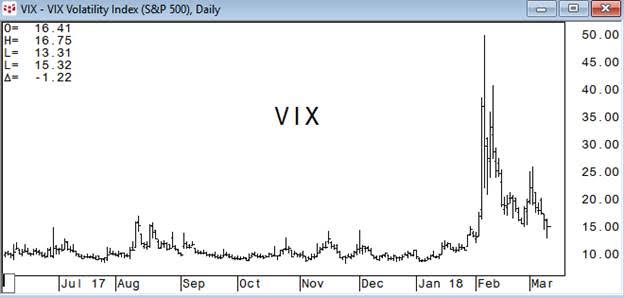
VIX is all the way back to levels prior to the vol-crisis. You knew this was going to happen, but it would be hard to believe
that VIX will go back to extreme lows for long after the carnage we saw just a month ago.
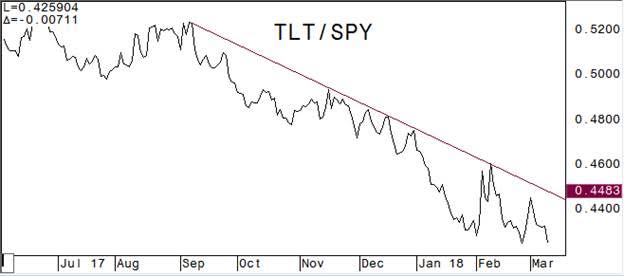
Fixed Income underperformed this week as risk-on–goldilocks-scenario emerged. How quickly long rates rise is the key to
potential reversals in equity indices. A relatively gradual trajectory in 10 and 30 year yields would likely be for stocks.
iShares Barclays 20+ Yr Treas.Bond (NYSE: TLT)
vs SPDR S&P 500 ETF Trust (NYSE: SPY) is
nearly back at the year lows.
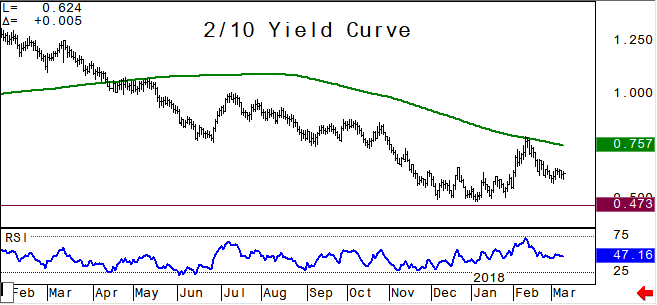
Yield curves will likely become a dominant theme going forward. The 2/10 yield curve had been steepening during the equity
weakness but, after hitting the 200-day moving average, the curve has flattened quickly and considerably. Short term support in the
2/10 at .556 percent and long term key support at .473 percent.
The Fed’s Charles Evans said on CNBC Friday that wage growth was a little on the weak side, and he sees merit to the argument
for waiting on rate hikes, "just a little big longer, considering low inflation."
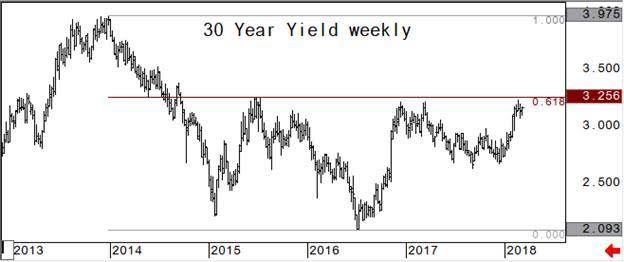
This seemed to help stem the decline in bonds, as the 30-year future was nearing a short term key support. USM8 has two key
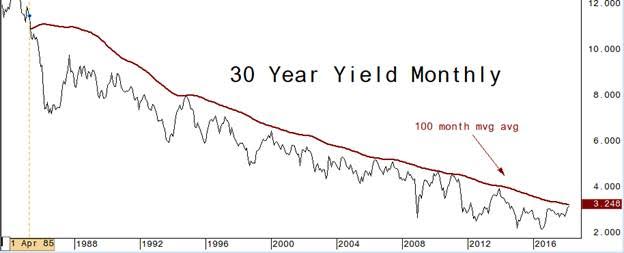
short term levels of support to be aware of; 142-21 and 142-03*. These next two charts show you just how important the 3.25 percent
level in 30 year yield is from a technical standpoint. A 618 retracement is considered a pivotal level using Fibonacci analysis,
and the 100-month moving average has been key resistance for years.
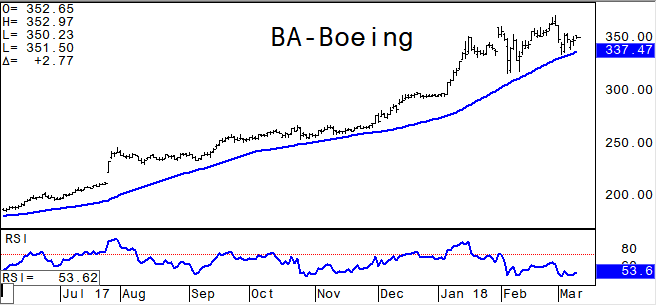
Boeing Co. (NYSE: BA) had only one day in
2017 where it broke below its 50dma. Momentum is about as depressed as it gets in BA which is leading us to believe a move higher
here is imminent.
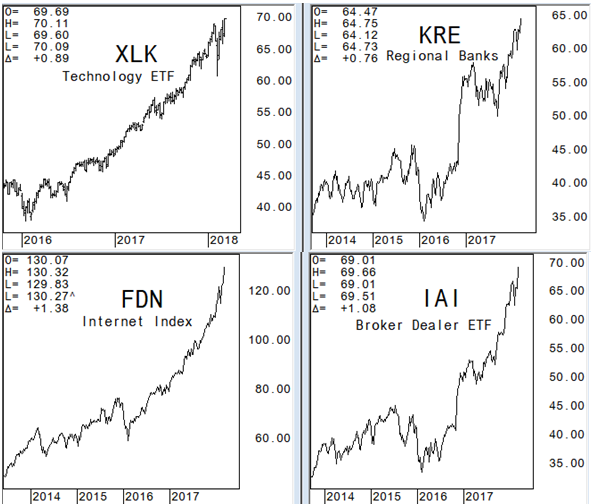
Technology, Regional Banks, Internet, and Broker Dealer sector ETFs are all putting in new all-time highs this week. Most
sectors within the S&P still have some work to do to get back to year highs, but some rotation into these sectors is a positive
for the overall market tone. We don’t want to have high correlations across multiple sectors because when there is a dip there is
nowhere to hide.
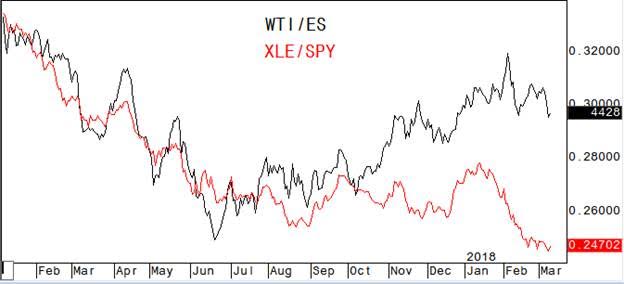
WTI had been outpacing the S&P 500 since June of last year, but has been underperforming since the vol-crisis low. The
energy sector relative to SPY has saw an unwind of the crowded energy sector trade since mid-January and the divergence with crude
oil is somewhat extreme. If we are looking for some rotational plays and improving global growth scenario energy should see a
reversion from current levels, especially if crude oil can hold above $59 area in WTI futures.
In conclusion: A softening or less controversial tone geopolitcally will help drive stocks higher. We will remain on guard for
potential breaking points in long bonds (and pivotal resistance levels in yields). 3.25 percent is coming in 30-year yield, but the
trajectory above this level will be important. Rotation between sectors has been and will remain a positive for overall market
strength. Stock and sector picking is key. Keep your head on a swivel for multiple days where everything is up, which could signal
danger down the road.
David Wienke is the editor of Keystone Charts. More than 30 years of experience
providing technical analysis and execution services to institutional clients is now provided in a daily newsletter, The Daily Game
Plan. Coverage includes equities, rates, currencies, and commodities. Dave is also an introducing broker with Capital Trading
Group, LLLP (CTG); a Chicago based investment firm specializing in execution and account management for CTAs and individual
investors. Charts are created using CQG, a top of the line trading and charting service. For a free trial of the Daily Game Plan
newsletter email me at dave@keystonecharts.net or go to Capital Trading Group to
subscribe.
For more information go to www.keystonecharts.net
DISCLAIMER: This is not a solicitation to buy or sell commodity futures or options on commodity futures and should not be
construed as such. The risk of trading securities, futures and options can be substantial and is not for everyone. Such investments
may not be appropriate for the recipient. The valuation of futures and options may fluctuate, and, as a result, clients may lose
more than their original investment. Nothing contained in this message may be construed as an express or an implied promise,
guarantee or implication by, of, or from Keystone Charts, Inc. that you will profit or that losses can or will be limited in any
manner whatsoever. Past performance is not necessarily indicative of future results. Although care has been taken to assure the
accuracy, completeness and reliability of the information contained herein, Keystone Charts, Inc. makes no warranty, express or
implied, or assumes any legal liability or responsibility for the accuracy, completeness, reliability or usefulness of any
information, product, service or process disclosed. PROPERTY OF KEYSTONE CHARTS, INC. DO NOT COPY OR FORWARD INTELLECTUAL PROPERTY
WITHOUT PRIOR WRITTEN CONSENT.
© 2018 Benzinga.com. Benzinga does not provide investment advice. All rights reserved.