DailyFX.com -
GOLD & CRUDE OIL TALKING POINTS:
- Gold prices rise but technical topping signs remain intact
- Crude oil prices rise to five-month high on Libya tensions
- Grim IMF economic outlook update might spook markets
Gold prices rose as the US Dollar weakened yesterday, in a
move that seemed to reflect the dovish implications of a surprise drop in wage inflation reported Friday on Fed policy
bets. Crude oil prices rose as on-going tensions in Libya drove supply disruption fears.
GRIM IMF OUTLOOK UPDATE MAY SPOOK FINANCIAL MARKETS
Looking ahead, the spotlight turns to an updated edition of the IMF World Economic Outlook (WEO). The fund has launched its annual spring meeting alongside
the World Bank and this release will set the stage. A downbeat tone echoing recent deterioration in global growth may sour risk
appetite.
This might weigh on bond yields and stoke haven demand for the US Dollar, offering conflicting cues to gold prices. The relative potency
of these forces relative to each other is likely to shape price action. Traders may withhold conviction altogether as
minutes from last month’s FOMC meeting loom ahead.
The response from pro-cyclical oil prices may be more straight-forwardly negative.
Separately, the EIA short-term energy outlook and API inventory flow data will hit the wires. The latter will be judged against bets on a
2.48-million-barrel inflow. The former put output at a record 12.3mb/d in 2019 last month.
See the latest gold and crude oil forecasts to learn what will drive
prices in the second quarter!
GOLD TECHNICAL ANALYSIS
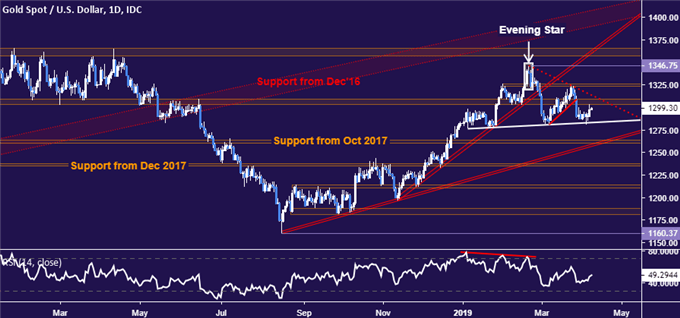
Gold prices bounced to retest resistance in the 1303.70-09.12 but the outlines of a choppy
Head and Shoulders (H&S) top remain intact. The outer bound of the latest series of lower highs is now at 1313.45, with a daily
close above that likely needed to neutralize near-term bearish cues. The next upside threshold is at 1326.30. Alternatively,
confirmation of the H&S setup on break below its neckline – now at 1283.41 – sets the stage for a test of trend line support
set from August 2018. This is currently at 1256.73.

CRUDE OIL TECHNICAL ANALYSIS
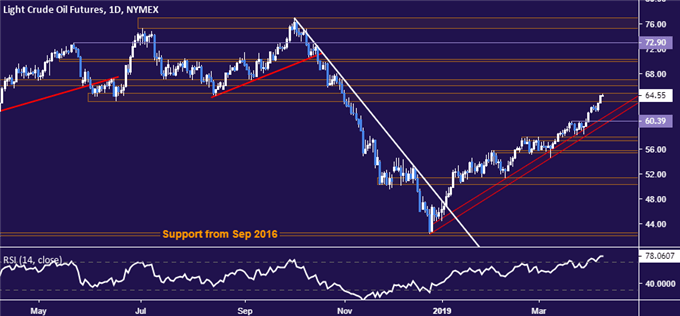
Crude oil prices rose to a five-month high to challenge support-turned-resistance in the
63.59-64.88 zone. This is swiftly followed by the 66.09-67.03 inflection area. A turn lower from here eyes rising trend line
support set from late December. The outer layer of that barrier is now at 59.79, with a daily close above below that initially
targets the 57.24-88 region.

COMMODITY TRADING RESOURCES
--- Written by Ilya Spivak, Currency Strategist for DailyFX.com
To contact Ilya, use the comments section below or @IlyaSpivak on Twitter
original source
DailyFX provides forex news and
technical analysis on the trends that influence the global currency markets.
Learn forex trading with a free practice account and trading charts from IG.