DailyFX.com -
SPOT GOLD PRICE CHART – TALKING POINTS
- Spot gold plunges below $1,300 after being rejected by technical resistance with added
downward pressure from a rallying US Dollar and Treasury rates following yesterday’s release of the Fed’s March FOMC meeting
minutes
- XAUUSD now looks to hold crucial technical support in order to maintain its medium-term
bullish uptrend
-
Do you trade gold? Check out these Top Gold Trading Strategies
and Tips or download the free DailyFX Q2 Gold
Forecast for comprehensive XAUUSD outlook
Gold is sinking today with spot prices trading roughly 1 percent lower and could put the
medium-term bullish uptrend at risk if the precious metal falls further. Month-to-date spot gold performance remains in positive
territory, however, despite today’s drop pushing gold below psychological support at the $1,300 level.
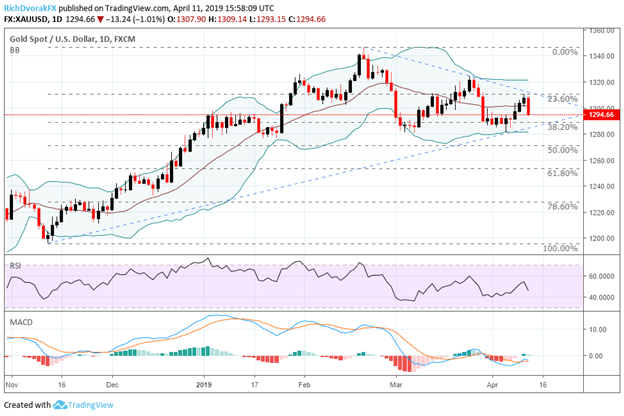
SPOT GOLD PRICE CHART: DAILY TIME FRAME (OCTOBER 31, 2018 TO APRIL 11, 2019)

Spot gold enjoyed a healthy rebound higher earlier this month after prices based at the
38.2 percent Fibonacci retracement line drawn from the low recorded in November 2018 and top printed in February 2019. Although,
the short-lived advance was halted once XAUUSD approached $1,310 yesterday where the 23.6 percent Fib and recent downtrend line
rejected further upside. Less-dovish Fed language revealed in the March FOMC minutes could be
contributing to the selling pressure in gold considering a surging US Dollar and rebounding interest rates make gold less
attractive.
Now, XAUUSD is re-approaching technical support near the $1,285 price where prices have
formed a strong area of confluence. Long-term uptrend support formed by the lows in November 2018 and earlier this month has
potential to bolster gold prices while the 38.2 percent Fib looks to provide support once again. Nevertheless, a break below the
rising trendline would likely threatens gold’s longer-term uptrend while a move above the falling trendline could reassert a
bullish bias.
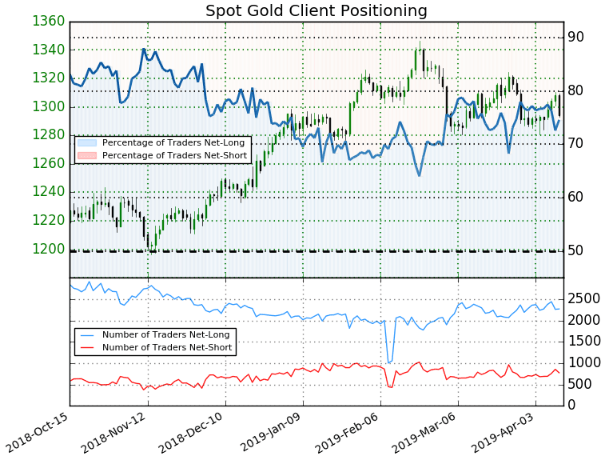
SPOT GOLD TRADER SENTIMENT PRICE CHART: DAILY TIME FRAME (OCTOBER 15, 2018 TO APRIL 11,
2019)

Check out IG’s Client Sentiment here for more detail on the bullish and
bearish biases of EURUSD, GBPUSD, USDJPY, Gold, Bitcoin and S&P500.
According to client positioning data from IG, 74.6
percent of spot gold traders are net-long with the ratio of traders long to short at 2.93 to 1. Although, the
number of traders net-long is 8.7 percent lower than yesterday and 6.5 percent lower than last week.
TRADING RESOURCES
Whether you are a new or experienced trader, DailyFX has multiple resources available to
help you: an indicator for monitoring trader sentiment; quarterly trading
forecasts; analytical and educational webinars held
daily; trading guides to help you improve trading performance, and even one for those who are new
to FX trading.
- Written by Rich Dvorak, Junior Analyst for DailyFX
- Follow @RichDvorakFX on Twitter
original
source
DailyFX provides forex news and
technical analysis on the trends that influence the global currency markets.
Learn forex trading with a free practice account and trading charts from IG.