DailyFX.com -
Australian Dollar Technicals Talking Points:
Technical Forecast for the Australian Dollar: Bearish
The Australian Dollar advanced across the board this past week, outperforming all its major
counterparts. For some of these pairings, the climb was attached to clearance of impressive technical barriers. Yet, given this
progress is coming off one of the most protracted ranges for the currency (on an equally-weighted index basis), the implications
for intent – or as traders would label it ‘follow through’ – should be considered carefully. Consider it this way: is breaking the
upper bound of an extremely limited but obvious range an immediate signal that we are committing to direction and a strong
escalation of momentum? A technical break does not ensure follow through. That said, the ‘tradability’ of such events largely
depends on how much run there is following the successful technical breach. Looking out over the broader FX market, trends are not
common fair for Dollar, Euro or even Yen-based crosses. And, while there may be a little more traction with the likes of US
equities and far less from other risk-oriented assets, the Aussie Dollar has shown very limited capacity to track ‘risk trends.’
This isn’t to say the bullish break this past week is for naught, but we should set expectations on progress reasonably.
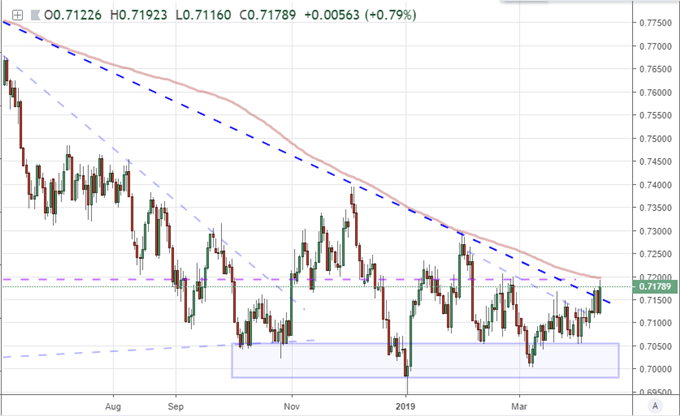
A good starting point for the confluence of liquidity and technical intent is AUDUSD. The
benchmark pair closed at its highest level since February 26th to close this
past week. Depending on where you pull your trendline from the peaks stretching back to early 2018, this would qualify as a
tentative breakout. That said, a trendline drawn from the highs of June 2018 to early December would still put a discernable level
overhead. There is more than just this unconfirmed (I look for 3 distinct points to pull trendlines) ray in the vicinity of 0.7200
that makes be believe there is still significant technical overhead to overcome. There also happens to be the 200-day moving
average and the 61.8% Fibonacci of the 2001 to 2011 bull phase all falling within a handful of pips of this same psychological
level. If anything, that is the critical hurdle to overcome.
Looking for a fundamental perspective on the aud? Check out the Weekly AUD Fundamental Forecast.
Chart of AUDUSD and 200-day Moving Average (Daily)
When we are looking at a Dollar-based major, there is always a consideration to be made
that what we are seeing in terms of direction and pace may reflect more the most liquid currency in the market rather than the
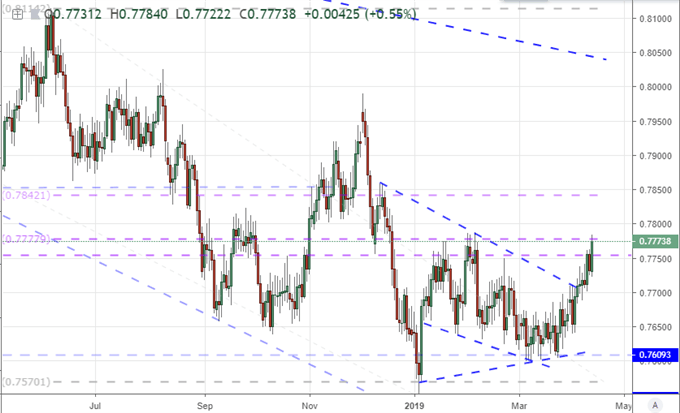
counterpart. So, when we take a look at an equally-weighted Aussie Dollar index, we find that its progress these past weeks is more
tangible. While this synthetic measure has moved to its highest levels seen this year (on a close basis), it hasn’t cleared a
reliable trend. Momentum reminds my principal concern for this currency – as it does with virtually everything else in the market –
and this simply does not yet have the spark of a self-sustaining charge.
Chart of an Equally-Weighted Aussie Dollar Index (Daily)
Wading through the crosses, the innate interest for retail speculative traders is to chase
the markets that look like they have produced a critical technical break. The appetite for ‘clean’ patterns that harken back to
textbooks is strong. Yet, market conditions suggest we should still consider options that can cater to ranges – which AUDUSD would
certainly qualify for, but it would insinuate a reversal from 0.7200 which is aggressive. There may, however, be something of a
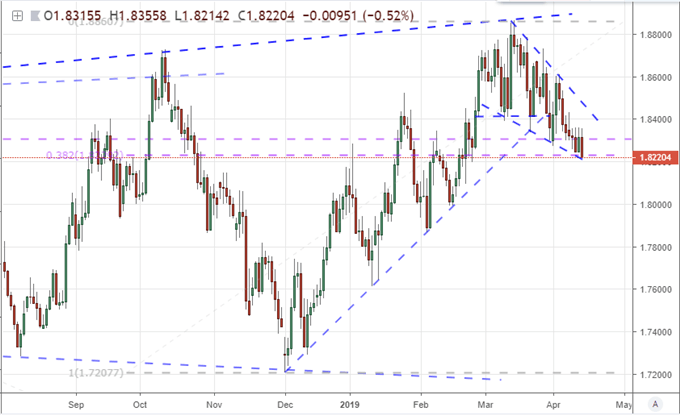
hybrid in which a break is actually a move into range. GBPAUD these past few weeks slid through successive levels of support, but
with limited momentum behind the effort. Rather than a break, this looks like a return back into a broad range which the Sterling
is more likely to commit to given the deferment of the Brexit decision for another six months. I don’t expect it will be a quick
and straight run, but an Aussie advance could have a better counterpart here.
Chart of GBPAUD (Daily)
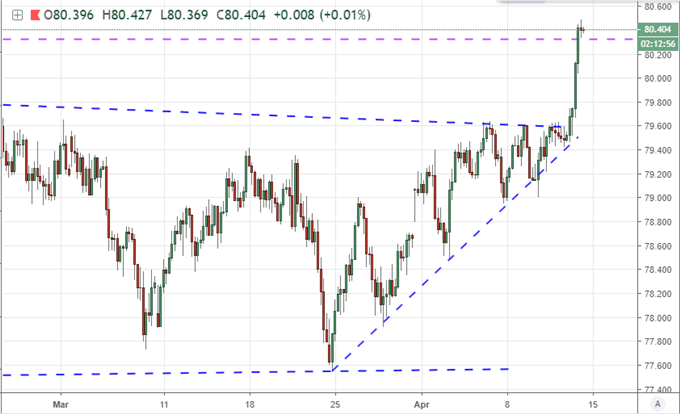
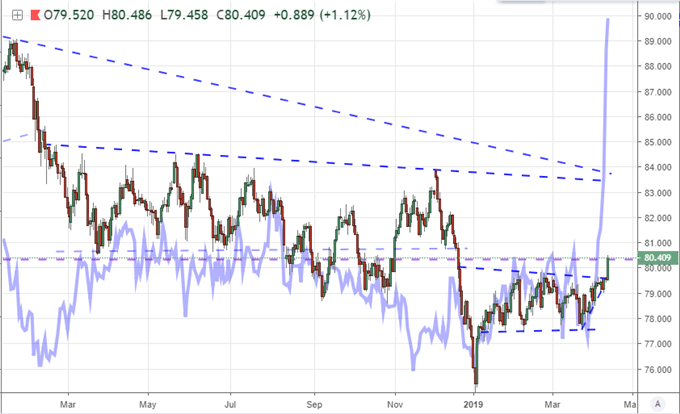
If, on the other hand, you are confident that the Australian Dollar’s recent efforts have
‘turned a technical’ corner and we are due to see strong follow through, then consider AUDJPY. The pair cleared a remarkably
consistent channel that formed in the aftermath of the January flash crash with a 79.60 break transmitting as cleanly as you can
expect from a technical breach. The four-hour chart with the three-week wedge forcing the more prolific resistance would certainly
qualify as ‘textbook’ in my evaluation.
Chart of AUDJPY (4-Hour)
Yet, again, it is important to repeat the mantra that breakout does not ensure follow
through. After months of restricted movement in the FX and financial markets, to presume the definitive shift in direction and
momentum is a lower probability endeavor. If we are looking for a motivational factor for sustained climb for the Aussie Dollar,
I’d point to the buoyancy in risk trends. While we can look to the S&P 500 or other similar benchmark, I prefer to refer to
volatility. Below, we have the AUDJPY overlaid with the inverted (upside down) aggregate of the EURUSD, USDJPY, GBPUSD implied
volatility readings from the CBOE. Volatility has essentially dropped to the lowest since these short series began less than five
years ago. That could add some gas to traders’ run, but it should be asked why this is only a motivation now?
Chart of AUDJPY and an Inverted FX Volatility Aggregate of CBOE Figures (Daily)
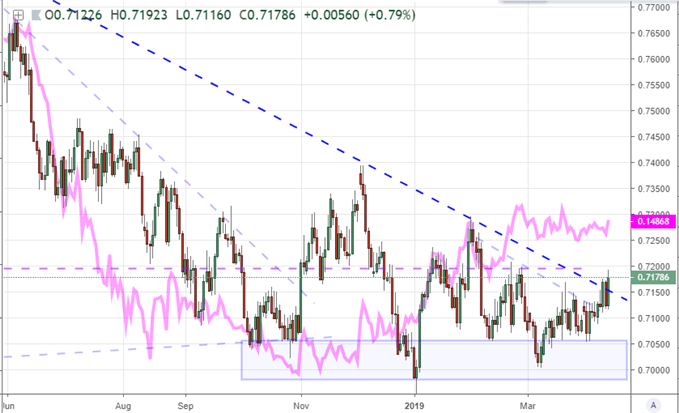
Another technical correlation that can speak a little more directly to the Australian
Dollar outside of its spotty risk appetite role can be found in the USDCNH. Below we have the traditional Dollar-Chinese Yuan
exchange rate flipped upside down. Back during the Great Financial Crisis, Australia famously avoided the global recession owing
largely to its economic ties to China. That connection has worked for and against the currency over the years, but recently the
Yuan has regained some traction. Should it continue to climb amid discussions of trade war negotiations, the Australian Dollar can
prove a significant benefactor – especially when it comes to a pair like AUDUSD.
Chart of AUDUSD and USDCNH Inverted (Daily)
Finally, the consideration in speculative positioning and intent. From the ‘big players’,
the net speculative futures positioning figures still has net interest at a historically heavy short skew. While not at the record,
it is within ready reach of that extreme. That suggests there is not a lot of dry powder for bears to readily jump on a renewed
short-side drive – though we could have said the same for the continued slide through 2015. The easing of the net short position
back in the fourth quarter of 2018 offers an encouraging assessment of the medium-term bias that may exist here whereby bulls are
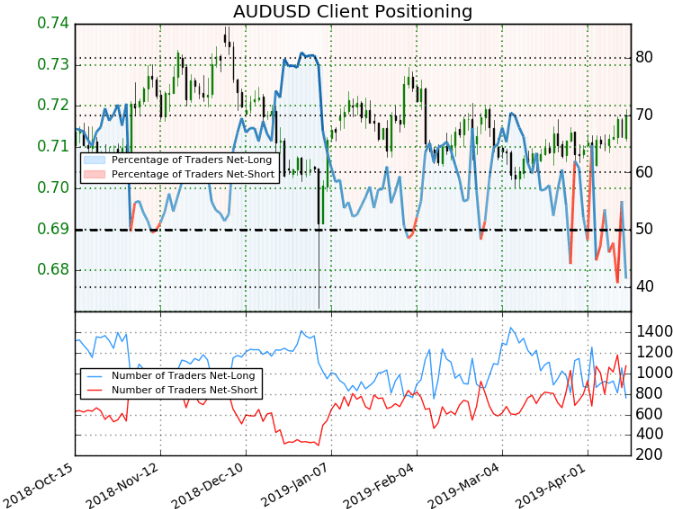
more ready to jump in than bears. In contrast, the retail traders are more than comfortable with taking advantage of the indecision
of the past months. There has been a clear bouncing back and forth in the net reading from long to short and back again in less
than a week. Retail is trading against the 200-day moving average resistance on AUDUSD, but there isn’t the same level of
conviction we saw with EURUSD at 1.1200.
Chart of Net Speculative Positioning in AUDUSD Futures from CFTC Report (Weekly)
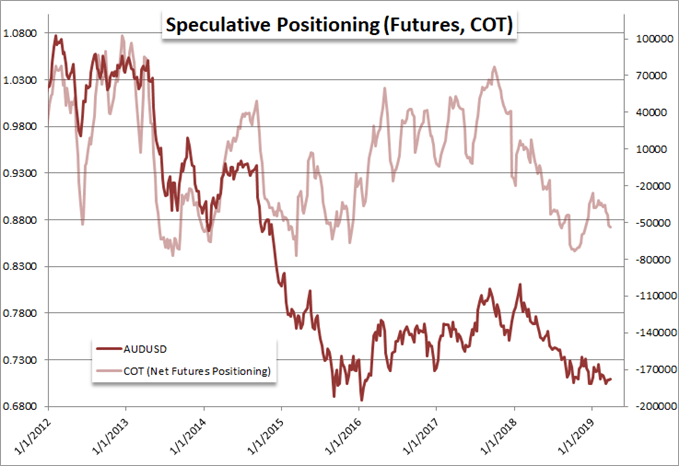
Chart of Retail Trader Positioning from IG Clients (Daily)
original source
DailyFX provides forex news and
technical analysis on the trends that influence the global currency markets.
Learn forex trading with a free practice account and trading charts from IG.