-- First Quarter Total Loan Origination Volume grew 44.1% to RMB4,172 million--
-- First Quarter Net Income grew 137.2% to RMB93.7 million--
SHANGHAI, China, June 07, 2021 (GLOBE NEWSWIRE) -- Jiayin Group Inc. (“Jiayin” or the “Company”) (NASDAQ: JFIN), a leading fintech platform in China, today announced its unaudited financial results for the first quarter ended March 31, 2021.
First Quarter 2021 Operational and Financial Highlights :
- Loan origination volume 1 was RMB4,172 million (US$636.8 million), representing an increase of 44.1% from the same period of 2020.
- Average borrowing amount per borrower was RMB6,198 (US$946.0), representing a decrease of 20.6% from the same period of 2020.
- Repeat borrowing rate 2 was 74.2%, compared with repeat borrowing rate of 85.4% in the same period of 2020.
- Net revenue was RMB343.1 million (US$52.4 million), representing an increase of 9.4% from the same period of 2020.
- Operating income was RMB113.8 million (US$17.4 million), compared with operating income of RMB51.1 million in the same period of 2020.
- Net income was RMB93.7 million (US$14.3 million), compared with net income of RMB39.5 million in the same period of 2020.
Mr. Yan Dinggui, the Founder, Director and Chief Executive Officer, commented, “We are pleased with our strong growth and momentum in the first quarter. Loan origination volume grew 44.1% year over year and reached RMB4.2 billion, with net income of RMB93.7 million, an increase of over 137% from the same period of 2020. These results demonstrate the success and sustainability of our rapid business transformation and robust growth, as we continuously optimize business operations and improve efficiency. Looking into the future, we see vast opportunities for expansion enabled by technological innovation, financial digitalization, and growing overseas market needs across various fintech sectors in which we operate. We remain confident in our business strategy and execution capacity, and believe we are well positioned to benefit from the accelerating growth in the consumption economy and digitalization.”
First Quarter 2021 Financial Results
Net revenue was RMB343.1 million (US$52.4 million), representing an increase of 9.4% from the same period of 2020.
Revenue from loan facilitation services was RMB320.9 million (US$49.0 million), representing an increase of 24.7% from the same period of 2020. The increase was primarily due to the increased loan origination volume from our institutional funding partners.
Revenue from post-origination services was nil, representing a decrease of 100.0% from the same period of 2020. The decrease was due to the outstanding loan balance of our legacy P2P lending business being reduced to zero in November 2020.
Other revenue was RMB22.2 million (US$3.4 million), representing an increase of 8.3% from the same period of 2020. The increase was primarily due to the development of the company's overseas business.
Origination and servicing expense was RMB64.1 million (US$9.8 million), representing an increase of 0.3% from the same period of 2020, primarily due to the increase in credit assessment expense resulting from higher loan origination volume partially offset by reduced collection costs as the Company no longer provides such services under its new business model.
Allowance for uncollectible receivables, contract assets, loans receivable and others was RMB8.0 million (US$1.2 million), representing a decrease of 73.7% from the same period of 2020, primarily due to the relatively lower credit risk of the new business model.
Sales and marketing expense was RMB91.2 million (US$13.9 million), representing a decrease of 2.4% from the same period of 2020, primarily due to the decrease in share-based compensation expense partially offset by higher borrower acquisition expenses.
General and administrative expense was RMB37.8 million (US$5.8 million), representing a decrease of 1.3% from the same period of 2020, primarily due to lower rental cost partially offset by the increase in other business-related expenses.
Research and development expense was RMB28.1 million (US$4.3 million), representing a decrease of 22.8% from the same period of 2020, primarily due to a more streamlined team in technology related departments.
Income from operations was RMB113.8 million (US$17.4 million), compared with an operating income of RMB51.1 million in the same period of 2020.
Net income was RMB93.7 million (US$14.3 million), compared with net income of RMB39.5 million in the same period of 2020.
Cash and cash equivalents were RMB123.3 million (US$18.8 million) as of March 31, 2021, compared with RMB117.3 million as of December 31, 2020.
The following table provides the delinquency rates for all outstanding loans on the Company's platform in Mainland China as of the respective dates indicated.
|
|
Delinquent for |
| As of |
|
1-30 days |
31-60 days |
61-90 days |
91 -180 days |
More than 180 days |
|
|
(%) |
| December 31, 2018 |
|
1.35 |
2.53 |
2.37 |
5.46 |
9.45 |
| December 31, 2019 |
|
1.27 |
2.20 |
1.68 |
4.79 |
8.39 |
| December 31, 2020 |
|
1.47 |
0.88 |
0.70 |
1.66 |
1.81 |
| March 31, 2021 |
|
1.17 |
0.85 |
0.71 |
1.56 |
2.53 |
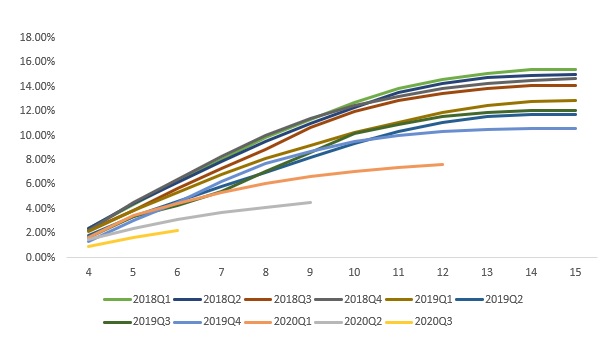
The following chart and table display the historical cumulative M3+ Delinquency Rate by Vintage for loan products facilitated through the Company’s platform in Mainland China.
|
Month on Book |
| Vintage |
4th |
5th |
6th |
7th |
8th |
9th |
10th |
11th |
12th |
13th |
14th |
15th |
| 2018Q1 |
2.41 |
% |
4.38 |
% |
6.21 |
% |
8.05 |
% |
9.80 |
% |
11.35 |
% |
12.71 |
% |
13.80 |
% |
14.61 |
% |
15.10 |
% |
15.38 |
% |
15.44 |
% |
| 2018Q2 |
2.43 |
% |
4.43 |
% |
6.15 |
% |
7.87 |
% |
9.47 |
% |
11.02 |
% |
12.30 |
% |
13.50 |
% |
14.25 |
% |
14.70 |
% |
14.94 |
% |
15.00 |
% |
| 2018Q3 |
2.23 |
% |
3.89 |
% |
5.66 |
% |
7.30 |
% |
8.89 |
% |
10.64 |
% |
12.00 |
% |
12.86 |
% |
13.47 |
% |
13.87 |
% |
14.07 |
% |
14.13 |
% |
| 2018Q4 |
2.26 |
% |
4.53 |
% |
6.38 |
% |
8.25 |
% |
9.99 |
% |
11.40 |
% |
12.44 |
% |
13.22 |
% |
13.83 |
% |
14.25 |
% |
14.53 |
% |
14.64 |
% |
| 2019Q1 |
2.17 |
% |
3.86 |
% |
5.32 |
% |
6.84 |
% |
8.13 |
% |
9.21 |
% |
10.21 |
% |
11.07 |
% |
11.85 |
% |
12.45 |
% |
12.80 |
% |
12.87 |
% |
| 2019Q2 |
1.83 |
% |
3.40 |
% |
4.59 |
% |
5.85 |
% |
6.98 |
% |
8.21 |
% |
9.35 |
% |
10.33 |
% |
11.08 |
% |
11.54 |
% |
11.73 |
% |
11.74 |
% |
| 2019Q3 |
1.64 |
% |
3.41 |
% |
4.26 |
% |
5.42 |
% |
7.03 |
% |
8.60 |
% |
10.13 |
% |
10.94 |
% |
11.59 |
% |
11.92 |
% |
12.04 |
% |
12.01 |
% |
| 2019Q4 |
1.31 |
% |
3.08 |
% |
4.52 |
% |
6.27 |
% |
7.69 |
% |
8.69 |
% |
9.51 |
% |
9.99 |
% |
10.31 |
% |
10.49 |
% |
10.55 |
% |
10.54 |
% |
| 2020Q1 |
1.67 |
% |
3.43 |
% |
4.46 |
% |
5.36 |
% |
6.11 |
% |
6.67 |
% |
7.09 |
% |
7.38 |
% |
7.61 |
% |
— |
|
— |
|
— |
|
| 2020Q2 |
1.46 |
% |
2.37 |
% |
3.11 |
% |
3.68 |
% |
4.14 |
% |
4.52 |
% |
— |
|
— |
|
— |
|
— |
|
— |
|
— |
|
| 2020Q3 |
0.96 |
% |
1.70 |
% |
2.24 |
% |
— |
|
— |
|
— |
|
— |
|
— |
|
— |
|
— |
|
— |
|
— |
|
Conference Call
The company will conduct a conference call on Monday, June 7, 2021 at 8:00 AM U.S. Eastern Time (8:00 PM Beijing/Hong Kong Time).
Please register in advance to join the conference using the link provided below and dial in 10 minutes before the call is scheduled to begin. Conference access information will be provided upon registration.
Participant Online Registration: http://apac.directeventreg.com/registration/event/2557578
A replay of the conference call may be accessed by phone at the following numbers until June 15, 2021. To access the replay, please reference the conference ID 2557578.
|
Phone Number |
Toll-Free Number |
| United States |
+1 (646) 254-3697 |
+1 (855) 452-5696 |
| Hong Kong |
+852 30512780 |
+852 800963117 |
| Mainland China |
|
+86 4006322162
+86 8008700205 |
A live and archived webcast of the conference call will be available on the company’s investors relations website at http://ir.jiayin-fintech.com/ .
About Jiayin Group Inc.
Jiayin Group Inc. is a leading fintech platform in China committed to facilitating effective, transparent, secure and fast connections between underserved individual borrowers and financial institutions. The origin of the business of the Company can be traced back to 2011. The Company operates a highly secure and open platform with a comprehensive risk management system and a proprietary and effective risk assessment model which employs advanced big data analytics and sophisticated algorithms to accurately assess the risk profiles of potential borrowers.
Exchange Rate Information
This announcement contains translations of certain RMB amounts into U.S. dollars (“US$”) at a specified rates solely for the convenience of the reader. Unless otherwise noted, all translations from RMB to U.S. dollars are made at a rate of RMB6.5518 to US$1.00, the exchange rate set forth in the H.10 statistical release of the Board of Governors of the Federal Reserve System as of March 31, 2021. The Company makes no representation that the RMB or US$ amounts referred could be converted into US$ or RMB, as the case may be, at any particular rate or at all.
Safe Harbor / Forward-Looking Statements
This announcement contains forward-looking statements. These statements are made under the “safe harbor” provisions of the United States Private Securities Litigation Reform Act of 1995. These forward-looking statements can be identified by terminology such as “will,” “expects,” “anticipates,” “future,” “intends,” “plans,” “believes,” “estimates” and similar statements. The Company may also make written or oral forward-looking statements in its periodic reports to the SEC, in its annual report to shareholders, in press releases and other written materials and in oral statements made by its officers, directors or employees to third parties. Statements that are not historical facts, including statements about the Company’s beliefs and expectations, are forward-looking statements. Forward-looking statements involve inherent risks and uncertainties and are based on current expectations, assumptions, estimates and projections about the Company and the industry. Potential risks and uncertainties include, but are not limited to, those relating to the Company’s ability to retain existing investors and borrowers and attract new investors and borrowers in an effective and cost-efficient way, the Company’s ability to increase the investment volume and loan origination of loans volume facilitated through its marketplace, effectiveness of the Company’s credit assessment model and risk management system, PRC laws and regulations relating to the online individual finance industry in China, general economic conditions in China, and the Company’s ability to meet the standards necessary to maintain listing of its ADSs on the Nasdaq Stock Market or other stock exchange, including its ability to cure any non-compliance with the continued listing criteria of the Nasdaq Stock Market. All information provided in this press release is as of the date hereof, and the Company undertakes no obligation to update any forward-looking statements to reflect subsequent occurring events or circumstances, or changes in its expectations, except as may be required by law. Although the Company believes that the expectations expressed in these forward-looking statements are reasonable, it cannot assure you that its expectations will turn out to be correct, and investors are cautioned that actual results may differ materially from the anticipated results. Further information regarding risks and uncertainties faced by the Company is included in the Company’s filings with the U.S. Securities and Exchange Commission, including its annual report on Form 20-F.
For more information, please contact:
In China:
Jiayin Group
Ms. Shelley Bai
Email: ir@jiayinfintech.cn
or
The Blueshirt Group
Ms. Susie Wang
Email: susie@blueshirtgroup.com
In the U.S.:
Ms. Julia Qian
Email: julia@blueshirtgroup.com
|
JIAYIN GROUP INC.
UNAUDITED CONDENSED CONSOLIDATED BALANCE SHEETS
(Amounts in thousands, except for share and per share data) |
|
|
|
As of
December 31, |
|
|
As of March 31, |
|
|
|
2020 |
|
|
2021 |
|
|
|
RMB |
|
|
RMB |
|
|
US$ |
|
| ASSETS |
|
|
|
|
|
|
|
|
|
|
|
|
| Cash and cash equivalents |
|
|
117,320 |
|
|
|
123,291 |
|
|
|
18,818 |
|
| Restricted cash |
|
|
2,000 |
|
|
|
2,000 |
|
|
|
305 |
|
| Amounts due from related parties |
|
|
542 |
|
|
|
44,742 |
|
|
|
6,829 |
|
| Accounts receivable and contract assets, net |
|
|
158,064 |
|
|
|
227,689 |
|
|
|
34,752 |
|
| Loan receivables, net |
|
|
31,296 |
|
|
|
27,652 |
|
|
|
4,221 |
|
| Prepaid expenses and other current assets |
|
|
61,289 |
|
|
|
61,609 |
|
|
|
9,403 |
|
| Deferred tax assets, net |
|
|
40,935 |
|
|
|
39,497 |
|
|
|
6,028 |
|
| Property and equipment, net |
|
|
19,449 |
|
|
|
15,848 |
|
|
|
2,419 |
|
| Right-of-use assets |
|
|
6,926 |
|
|
|
12,062 |
|
|
|
1,841 |
|
| Long-term investment |
|
|
87,551 |
|
|
|
87,684 |
|
|
|
13,383 |
|
| TOTAL ASSETS |
|
|
525,372 |
|
|
|
642,074 |
|
|
|
97,999 |
|
| LIABILITIES AND EQUITY |
|
|
|
|
|
|
|
|
|
|
|
|
| Payroll and welfare payable |
|
|
58,288 |
|
|
|
59,965 |
|
|
|
9,152 |
|
| Amounts due to related parties |
|
|
8,785 |
|
|
|
3,514 |
|
|
|
536 |
|
| Tax payables |
|
|
279,383 |
|
|
|
297,218 |
|
|
|
45,364 |
|
| Accrued expenses and other current liabilities |
|
|
70,954 |
|
|
|
67,274 |
|
|
|
10,268 |
|
| Other payable related to the disposal of Shanghai Caiyin |
|
|
566,532 |
|
|
|
566,532 |
|
|
|
86,471 |
|
| Lease liabilities |
|
|
5,195 |
|
|
|
11,479 |
|
|
|
1,752 |
|
| TOTAL LIABILITIES |
|
|
989,137 |
|
|
|
1,005,982 |
|
|
|
153,543 |
|
| SHAREHOLDERS' DEFICIT |
|
|
|
|
|
|
|
|
|
|
|
|
Class A ordinary shares (US$ 0.000000005 par value;
108,100,000 shares issued and outstanding as of December 31, 2020
and March 31, 2021) 3 |
|
|
0 |
|
|
|
0 |
|
|
|
0 |
|
Class B ordinary shares (US$ 0.000000005 par value;
108,000,000 shares issued and outstanding as of December 31, 2020
and March 31, 2021) 3 |
|
|
0 |
|
|
|
0 |
|
|
|
0 |
|
| Additional paid-in capital |
|
|
818,042 |
|
|
|
823,952 |
|
|
|
125,760 |
|
| Accumulated deficit |
|
|
(1,266,848 |
) |
|
|
(1,173,635 |
) |
|
|
(179,132 |
) |
| Accumulated other comprehensive loss |
|
|
(12,817 |
) |
|
|
(13,684 |
) |
|
|
(2,089 |
) |
| Total Jiayin Group Inc. shareholder's deficit |
|
|
(461,623 |
) |
|
|
(363,367 |
) |
|
|
(55,461 |
) |
| Non-controlling interests |
|
|
(2,142 |
) |
|
|
(541 |
) |
|
|
(83 |
) |
| TOTAL SHAREHOLDERS' DEFICIT |
|
|
(463,765 |
) |
|
|
(363,908 |
) |
|
|
(55,544 |
) |
| TOTAL LIABILITIES AND DEFICIT |
|
|
525,372 |
|
|
|
642,074 |
|
|
|
97,999 |
|
|
|
|
|
|
|
|
|
|
|
|
|
|
|
JIAYIN GROUP INC.
UNAUDITED CONDENSED CONSOLIDATED STATEMENTS OF COMPREHENSIVE INCOME
(Amounts in thousands, except for share and per share data) |
|
|
|
For the Three Months Ended
March 31, |
|
|
|
2020 |
|
|
2021 |
|
|
|
RMB |
|
|
RMB |
|
|
US$ |
|
Net revenue (including revenue from related parties of RMB 1,118,
and RMB 11,811 for 2020Q1 and 2021Q1, respectively) |
|
|
313,526 |
|
|
|
343,055 |
|
|
|
52,360 |
|
| Operating cost and expenses: |
|
|
|
|
|
|
|
|
|
|
|
|
| Origination and servicing |
|
|
(63,936 |
) |
|
|
(64,099 |
) |
|
|
(9,783 |
) |
Allowance for uncollectible receivables,
contract assets, loans receivable and others |
|
|
(30,405 |
) |
|
|
(8,010 |
) |
|
|
(1,223 |
) |
| Sales and marketing |
|
|
(93,437 |
) |
|
|
(91,245 |
) |
|
|
(13,927 |
) |
| General and administrative |
|
|
(38,264 |
) |
|
|
(37,793 |
) |
|
|
(5,768 |
) |
| Research and development |
|
|
(36,367 |
) |
|
|
(28,121 |
) |
|
|
(4,292 |
) |
| Total operating cost and expenses |
|
|
(262,409 |
) |
|
|
(229,268 |
) |
|
|
(34,993 |
) |
| Income from operation |
|
|
51,117 |
|
|
|
113,787 |
|
|
|
17,367 |
|
| Interest income (expense) |
|
|
1,982 |
|
|
|
(905 |
) |
|
|
(138 |
) |
| Other income, net |
|
|
1,017 |
|
|
|
1,936 |
|
|
|
295 |
|
| Income before income taxes and income from investment in affiliates |
|
|
54,116 |
|
|
|
114,818 |
|
|
|
17,524 |
|
| Income tax expense |
|
|
(13,937 |
) |
|
|
(22,169 |
) |
|
|
(3,384 |
) |
| (Loss) income from investment in affiliates |
|
|
(729 |
) |
|
|
1,025 |
|
|
|
156 |
|
| Net income |
|
|
39,450 |
|
|
|
93,674 |
|
|
|
14,296 |
|
| Less: net (loss) income attributable to noncontrolling interest shareholders |
|
|
(1,026 |
) |
|
|
461 |
|
|
|
70 |
|
| Net income attributable to Jiayin Group Inc. |
|
|
40,476 |
|
|
|
93,213 |
|
|
|
14,226 |
|
Weighted average shares used in calculating net
income per share: |
|
|
|
|
|
|
|
|
|
|
|
|
| - Basic and diluted |
|
|
216,100,000 |
|
|
|
216,100,000 |
|
|
|
216,100,000 |
|
| Net income per share: |
|
|
|
|
|
|
|
|
|
|
|
|
| - Basic and diluted |
|
|
0.19 |
|
|
|
0.43 |
|
|
|
0.07 |
|
| Net income |
|
|
39,450 |
|
|
|
93,674 |
|
|
|
14,296 |
|
| Other comprehensive income, net of tax of nil: |
|
|
|
|
|
|
|
|
|
|
|
|
| Foreign currency translation adjustments |
|
|
3,968 |
|
|
|
(964 |
) |
|
|
(147 |
) |
| Comprehensive income |
|
|
43,418 |
|
|
|
92,710 |
|
|
|
14,149 |
|
| Comprehensive (loss) income attributable to noncontrolling interest |
|
|
(994 |
) |
|
|
364 |
|
|
|
56 |
|
Total comprehensive income attributable to
Jiayin Group Inc. |
|
|
44,412 |
|
|
|
92,346 |
|
|
|
14,093 |
|
|
|
|
|
|
|
|
|
|
|
|
|
|
_____________________________
1 “Loan origination volume” refers the loan origination volume facilitated in Mainland China during the period presented.
2 “Repeat borrowing rate” refers to the repeat borrowers as a percentage of all of our borrowers in Mainland China.
3 The total shares authorized for both Class A and Class B are 10,000,000,000,000.