TORONTO, April 21, 2022 (GLOBE NEWSWIRE) -- Fox River Resources Corporation (the “Company” or “Fox River”) (CSE: FOX) is pleased to announce the positive results of a Preliminary Economic Assessment (“PEA”) and updated Mineral Resource Estimate (“MRE”) for its 100%-owned Martison Phosphate Project (the “Project”), located near Hearst, Ontario. All currency figures are shown in United States dollars, unless otherwise noted.
Martison Phosphate Project - Robust Financial Metrics in a World-Class Jurisdiction
- At current prices, the PEA defines a pre-tax NPV8% of $3.53B and IRR of 26.8% with an after-tax payback period of 4.0 years and after-tax NPV8% of $2.51B and IRR of 23.1%.
- Base case economics outline a pre-tax NPV8% of $2.14B and IRR of 20.2% with an after-tax payback period of 5.2 years and after-tax NPV8% of $1.47B and IRR of 17.4%.
- Compelling economics at 30% below base case prices, delivering a pre-tax NPV8% of $457M and IRR of 10.9%.
- Life of Project Revenue of $20.55B and cash flow of $6.46B at base case pricing.
Table 1 – Pre-Tax NPV8% Sensitivity Analysis(1)
|
30% Below
Base Case |
Base Case |
Intermediate
Case |
Current Case |
30% Above
Current Case |
| MAP Price |
$560 |
$800 |
$980 |
$1,160 |
$1508 |
| SPA (68% P2O5) Price |
$742 |
$1,060 |
$1,220 |
$1,380 |
$1794 |
| NPS Price |
$567 |
$810 |
$990 |
$1,170 |
$1,521 |
| Sulphur Price |
$192 |
$274 |
$356 |
$438 |
$569 |
| Ammonia Price |
$421 |
$602 |
$1,115 |
$1,627 |
$2,115 |
Pre-Tax NPV8%
(USD$M) |
$457 |
$2,144 |
$2,836 |
$3,528 |
$5,630 |
| ¹ Please see “Notes to Tables 1 to 3” below Table 3 for all assumptions. |
Table 2 – After-Tax NPV8% Sensitivity Analysis(1)
|
30% Below
Base Case |
Base Case |
Intermediate Case |
Current Case |
30% Above
Current Case |
| MAP Price |
$560 |
$800 |
$980 |
$1,160 |
$1508 |
| SPA (68% P2O5) Price |
$742 |
$1,060 |
$1,220 |
$1,380 |
$1794 |
| NPS Price |
$567 |
$810 |
$990 |
$1,170 |
$1,521 |
| Sulphur Price |
$192 |
$274 |
$356 |
$438 |
$569 |
| Ammonia Price |
$421 |
$602 |
$1,115 |
$1,627 |
$2,115 |
After-Tax NPV8%
(USD$M) |
$184 |
$1,467 |
$1,989 |
$2,509 |
$4,088 |
| ¹ Please see “Notes to Tables 1 to 3” below Table 3 for all assumptions. |
Table 3 – IRR, Payback, and LOP Cash Flow Sensitivity Analysis(1)
|
30% Below
Base Case |
Base Case |
Intermediate Case |
Current Case |
30% Above
Current Case |
| MAP Price |
$560 |
$800 |
$980 |
$1,160 |
$1508 |
| SPA (68% P2O5) Price |
$742 |
$1,060 |
$1,220 |
$1,380 |
$1794 |
| NPS Price |
$567 |
$810 |
$990 |
$1,170 |
$1,521 |
| Pre-Tax IRR |
10.9% |
20.2% |
23.6% |
26.8% |
36.2% |
| After-Tax IRR |
9.3% |
17.4% |
20.3% |
23.1% |
30.9% |
| After-Tax Payback (years) |
8.6 |
5.2 |
4.5 |
4.0 |
3.0 |
| Cumulative Cash Flow (USD$M) |
$2,911 |
$6,460 |
$7,917 |
$9,373 |
$13,797 |
¹ Please see “Notes to Tables 1 to 3” below Table 3 for all assumptions.
|
Notes to Tables 1 to 3:
- All results developed at an exchange rate of 0.79365 USD/CAD for the CAPEX and OPEX calculations. Product prices are in US Dollars per metric tonne.
- The “Base Case” is a weighted average of three market forecast scenarios for the years 2022 to 2047.
- Current prices are based on values during the first half of April 2022 and are a weighted average of delivered prices to target markets in Canada and the United States.
- For further information see the notes to Table 4.
Project Description
The proposed Martison Phosphate Project is a vertically integrated mining and fertilizer complex utilizing an igneous phosphate deposit located approximately 70 km north of Hearst, Ontario, Canada. The PEA examined the types and quantities of fertilizers which will be produced, the process technology deployed, and the sulfur technology utilized in making fertilizer products from the phosphate concentrate.
The location of the Martison project is shown below in Figure 1.
Figure 1: Regional location of the Martison Project Sites
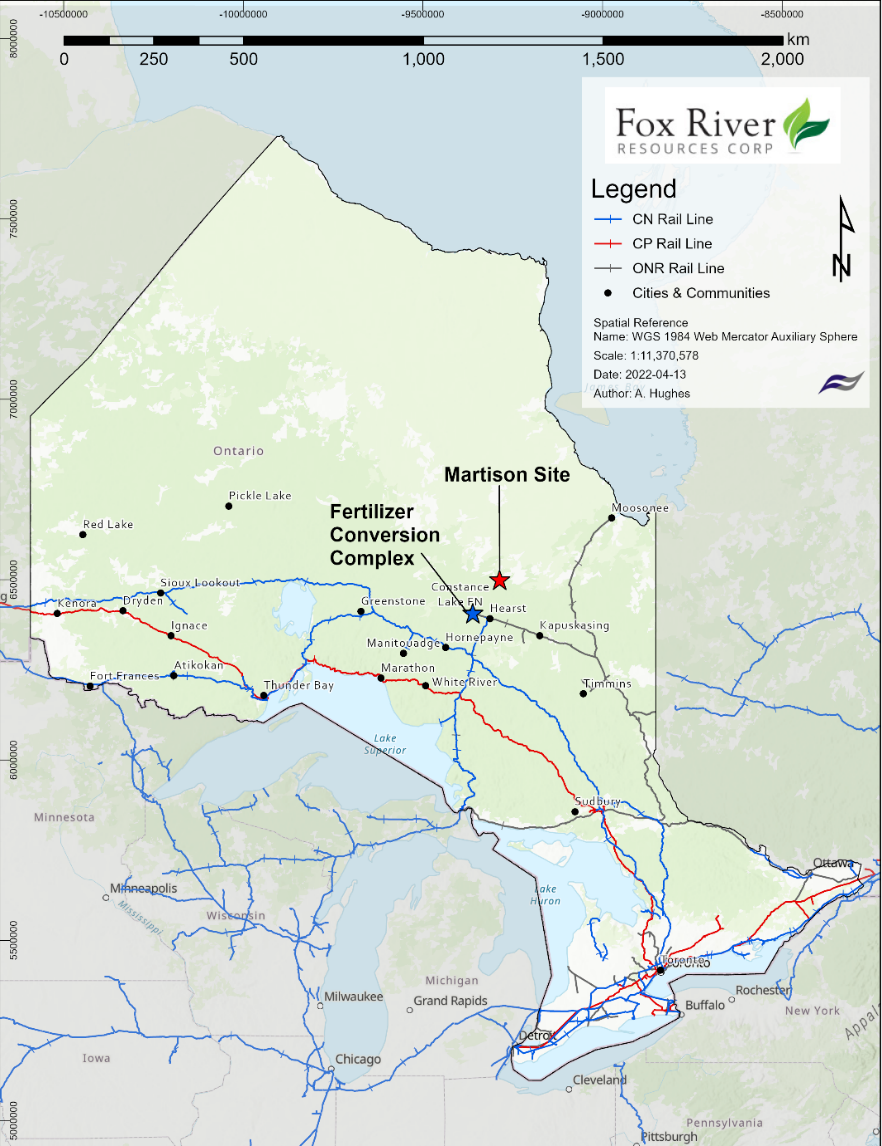
The Project design entails an open pit mine, a phosphate beneficiation plant (located at the mine site), a slurry pipeline, a road corridor, and a Fertilizer Conversion Complex (FCC) located west of Hearst, Ontario, and 86 km south of the mine site. The FCC location is in close proximity to existing rail, power, and natural gas infrastructure. This facility includes a phosphoric acid plant, a super phosphoric acid plant, a granulation plant, a sulfur conversion plant with co-generation capacity, a warehouse and loadout facility, and a railyard.
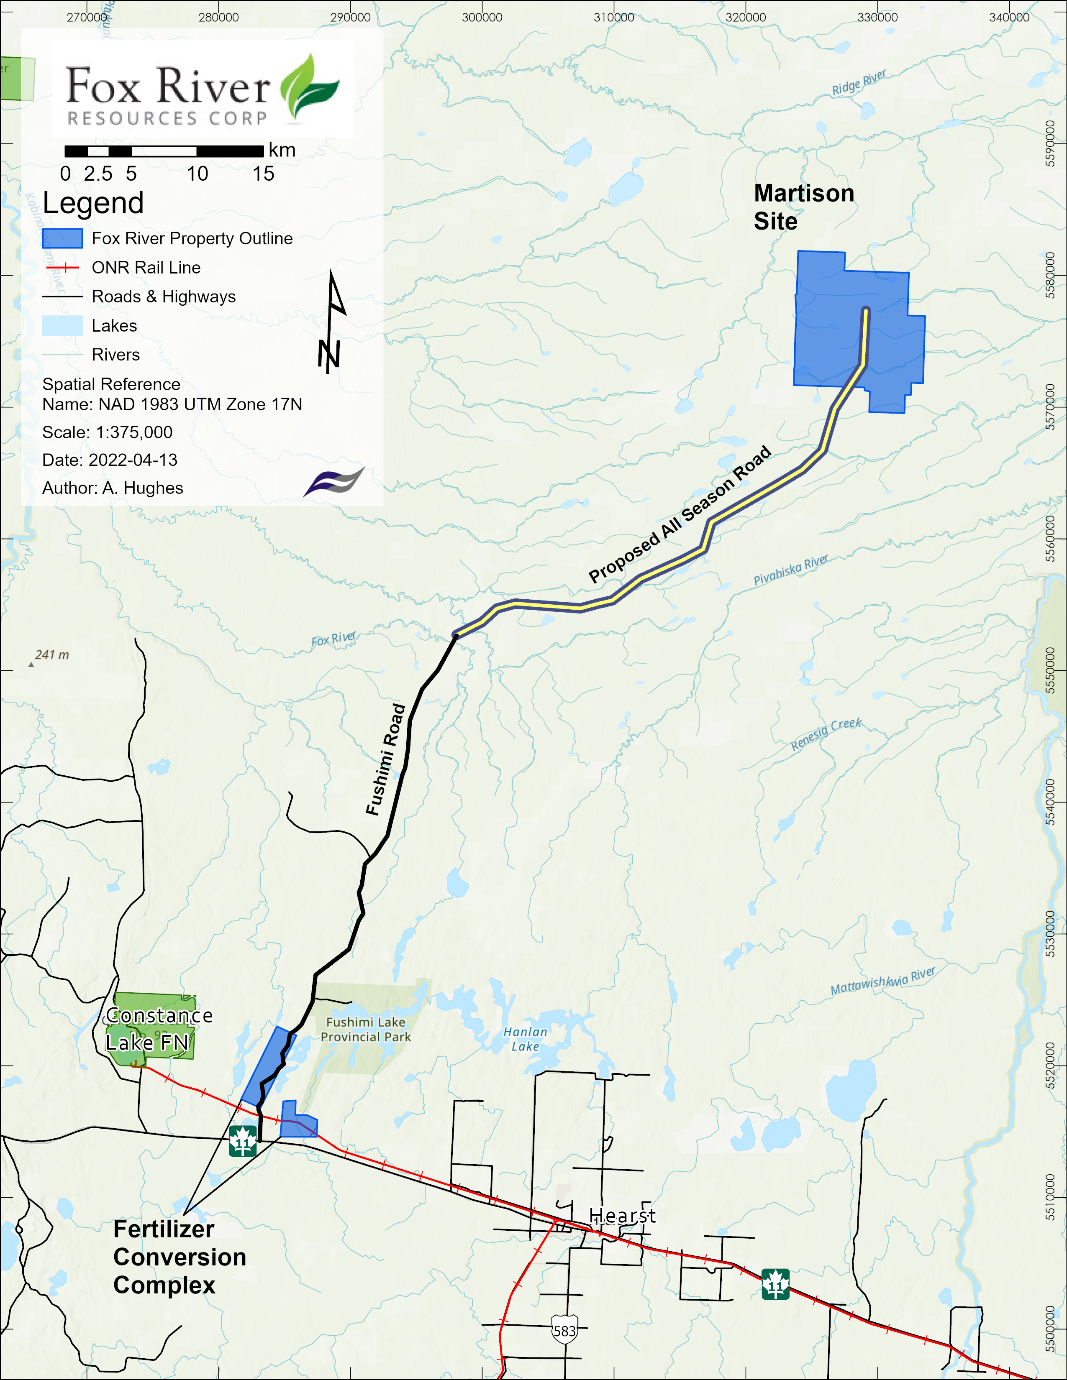
A map of the Martison Mine Site and Fertilizer Conversion Complex is provided below in Figure 2.
Figure 2: Location map of the Fertilizer Conversion Complex and the Martison Mine Site
Based on the current Indicated and Inferred resources, the Project has a 26-year mine life with the potential for extension should additional resources be identified. The PEA has examined the economics of producing 221,000 solution tonnes per year of super phosphoric acid (SPA), 474,000 tonnes of granular monoammonium phosphate (MAP) and 247,000 tonnes of granular nitrogen, phosphate + sulfur (NPS) at the proposed FCC. The target market includes the Eastern Canadian provinces, Canadian Prairie provinces and U.S. northern tier states. The Martison facility will capture a freight advantage relative to U.S. and offshore producers in its target market, and especially in nearby Canadian provinces where demand is projected to grow and where a larger share of Martison output is forecast to ship over time. The current total addressable markets (TAMs) for MAP, NPS and SPA are estimated to total about 4.0, 2.0 and 0.7 million tonnes, respectively. Canadian demand is forecast to continue to grow at moderate but lower rates than the extraordinary pace of the last ten years.
Management Commentary
Stephen Case, President and Chief Executive Officer of the Company commented, “We have witnessed substantial movement within the fertilizer sector over the past ten years and believe the time is right to advance Martison — an igneous phosphate deposit that already meets the most stringent cadmium restrictions being implemented by the European Union. The Western Canadian phosphate market demand has doubled in the past decade and remains the fastest growing market in North America — a market which the Martison project is designed to serve. With no current domestic production of finished phosphate products in Canada and a competitive operating cost, Martison is uniquely positioned to capture these markets that are primarily served by producers in Central Florida, Idaho and the Gulf Coast. In addition, given the increasing protectionism in the fertilizer sector over the past year, it is imperative that a domestic source of phosphate fertilizers be developed in Canada.
“The geological model suggests that the Martison deposit is not yet fully defined, specifically to the northwest and at depth of Anomaly A. The niobium in both the lateritic material and in the phosphate tailings also remains of economic interest and requires further work.
“As the world continues its current path of balkanization, the geopolitical risks globally are now starting to impact direct investment in regions where government regimes and taxation remain constant uncertainties. Operating in a global leading mining jurisdiction, such as Canada, may prove to be yet another distinct and positive advantage for the Martison project.”
Martison Project Preliminary Economic Assessment
The PEA, completed in accordance with National Instrument 43-101 (“NI 43-101”) with an effective date of April 21, 2022, was prepared by Hatch Ltd., JESA Technologies LLC, DMT Consulting Limited, Ausenco Inc., and Chemetics Inc. and a technical report relating to the PEA will be filed on SEDAR within 45 days of this news release.
Table 4 – Key Information Summary
| Description |
Units |
PEA |
| Product Prices / Input Costs / FX |
|
Base Case¹ |
Current Prices2 |
| Product Prices |
|
|
|
| Mono Ammonium Phosphate (MAP)3 |
US$/t DEL |
$800 |
$1,160 |
| Super Phosphoric Acid 68% P2O5 (SPA)4 |
US$/t DEL |
$1,060 |
$1,380 |
| Nitrogen, Phosphate, Sulfur (NPS)5 |
US$/t DEL |
$810 |
$1,170 |
| Input Costs |
|
|
|
| Sulfur6 |
US$/t DEL |
$274 |
$438 |
| Ammonia7 |
US$/t DEL |
$602 |
$1,627 |
| Currency Exchange Rate |
USD/CAD |
0.79365 |
0.79365 |
| Production Data |
|
|
|
| Mine Site |
|
|
|
| Total Tonnes Mined, Life of Mine Plan |
Mt/Dry |
409.48 |
409.48 |
| Beneficiation Mill Feed, Life of Mine Plan |
Mt/Dry |
83.61 |
83.61 |
| Concentrate Grade |
% P2O5 |
37.28 |
37.28 |
| Mine Life |
Years |
26 |
26 |
| Average Mill Feed (Years 3-25) |
Mt/y |
3.35 |
3.35 |
| Phosphate Concentrate Production (Years 3-25) |
Mt/y |
1.41 |
1.41 |
| Average Life of Mine (LOM) Mining Cost |
US$/t conc. |
$31.64 |
$31.64 |
| Average LOM Beneficiation Cost |
US$/t conc. |
$15.25 |
$15.25 |
| Average LOM Concentrate Cost (Including Infrastructure) |
US$/t conc. |
$55.10 |
$55.10 |
| Average LOM Concentrate Cost (Including Slurry Pipeline Cost) |
US$/t conc. |
$56.24 |
$56.24 |
| Fertilizer Conversion Complex (FCC) |
|
|
|
| Phosphoric Acid Plant Capacity |
P2O5 t per annum |
500,000 |
500,000 |
| P2O5 Production Cash Costs |
US$/t P2O5 |
$423.02 |
$556.90 |
| SPA Plant Capacity |
P2O5 t per annum |
150,000 |
150,000 |
| SPA Production Cash Costs |
US$/t SPA |
$395.16 |
$507.78 |
| Granulation Plant Capacity |
P2O5 t per annum |
346,000 |
346,000 |
| MAP Production Cash Costs |
US$/t MAP |
$319.10 |
$522.97 |
| NPS Production Cash Costs |
US$/t NPS |
$321.34 |
$536.91 |
| Sulphur Plant Capacity |
|
|
|
| Sulfuric Acid Produced & Consumed (Years 3-25) |
H2SO4 t per annum |
1,276,000 |
1,276,000 |
| Annual Co-Generation Production (Net) |
MW |
31 |
31 |
| Average Annual Product Tonnes (Years 3-25) |
|
|
|
| MAP |
t |
474,000 |
474,000 |
| NPS |
t |
247,000 |
247,000 |
| SPA |
t |
221,000 |
221,000 |
| Average Annual Consumption (Years 3-25) |
|
|
|
| Sulfur |
t |
433,000 |
433,000 |
| Ammonia for MAP |
t |
63,000 |
63,000 |
| Ammonia for NPS |
t |
36,100 |
36,100 |
| Life-of-Project (LOP) Operating Costs |
|
|
|
| Average Annual Cash Operating Costs8 |
US$M/y |
$307.13 |
$475.08 |
| Average Annual OPEX + Sustaining CAPEX (SUSEX) |
US$M/y |
$328.61 |
$496.55 |
| Capital Costs |
|
|
|
| Initial CAPEX9 |
US$M |
$1,859 |
$1,859 |
| LOP SUSEX |
US$M |
$545 |
$545 |
| Financial Analysis |
|
|
|
| After-Tax NPV8% |
US$M |
$1,467 |
$2,509 |
| After Tax IRR |
% |
17.4 |
23.1 |
| Payback Period |
years |
5.2 |
4.0 |
1. The “Base Case” is a weighted average of three market forecast scenarios for the years 2022 to 2047.
2. Current prices are based on values during the first half of April 2022 and are a weighted average of delivered prices to target markets in Canada and the United States.
3. Reference prices ($CAD/tonne MAP delivered Western Canada) for Base & Current Cases are $1,060 and $1,470 respectively.
4. Reference prices ($US/tonne P2O5 delivered Corn Belt) for Base & Current Cases are $1,570 and $2,020 respectively.
5. Reference prices ($CAD/tonne NPS delivered Western Canada) for Base & Current Cases are $1,065 and $1,480 respectively.
6. Reference prices ($US/long ton S CIF Tampa) for Base & Current Cases are $320 and $481 respectively.
7. Reference prices ($US/tonne NH3 CIF Tampa) for Base & Current Cases are $630 and $1,625 respectively.
8. Total operating costs include administration, operations, maintenance costs at the Mine and FCC sites, plus SG&A costs.
9. Includes constructed costs, contractor's fee, contingency, and owner’s costs.
Table 5 – Total CAPEX
| Capital Costs |
(US$M) |
| Mine Site Preparation |
22.6 |
| Mine |
60.7 |
| Mine Mobile Equipment |
90.2 |
| Mill (Beneficiation Plant) incl. Mobile Equip |
190.0 |
| Infrastructure and Utilities |
24.7 |
| Tailings Management Facility |
41.5 |
| Access Road, Haul Roads, In-Plant Roads |
37.4 |
| Power Line, Substations and Transformers |
54.8 |
| Slurry Pipeline |
109.5 |
| Sulfur Plant and Cogeneration |
274.6 |
| Phosphoric Acid Plant |
286.7 |
| Super Phosphoric Acid Plant |
88.4 |
| Granulation Plant |
143.2 |
| Warehouse and Loadout Facilities |
15.2 |
| Railyard and mobile equipment |
28.3 |
| Infrastructure and services |
64.9 |
| Sub-total |
1,532.9 |
| Owner’s Costs |
76.6 |
| Contingency |
250.0 |
| Total |
1,859.5 |
Mineral Resource Estimate (“MRE”) Update Effective December 31, 2021
The Martison deposit is formed from an igneous intrusion (carbonatite) and differential weathering of the Martison igneous complex has resulted in an irregular weathered karst type surface to the basement carbonatite. Depressions in this carbonate rich surface are filled with the weathered breakdown product of the carbonatite, a residuum (the “Residuum”), which is effectively a paleo – soil profile. The Residuum is apatite rich and is the main source of the phosphatic material of economic importance. Above the Residuum lies a less consistent layer of iron rich, pseudo-lateritic material, containing niobium and REE’s mineralisation, also at levels of economic interest.
Since the re-issue of the 2015 MRE in April 2016 in favour of Fox River Resources Corporation, a review and revision of the geological model has been carried out, with greater emphasis on the deposits geo-chemistry in response to the on-going metallurgical studies, and the projected downstream effects this may have on the proposed Project mineral flow sheet. Historically, exploration work has collectively accumulated close to 22,000 metres of drill core for a total of approximately 8,170 samples analysed.
The Mineral Resources for Anomaly A are reported within a conceptual (Whittle) open pit at a cut-off grade of 6% P2O5.
The Anomaly A Lateritic material remains a source of economic interest for Niobium and Rare Earth Elements (REE’s).
Table 6 - Martison Anomaly A Mineral Resource Estimate Effective December 31, 2021
| Deposit |
Classification |
Tonnes
(Mt) |
Phosphate Grade
(% P2O5) |
Niobium Grade
(% Nb2O5) |
Anomaly A
Residuum
|
Indicated Resources |
53.8 |
22.99 |
0.42 |
| Inferred Resources |
128.3 |
17.09 |
0.42 |
Anomaly A
Lateritic Material
|
Indicated Resources |
6.2 |
7.97 |
1.13 |
| Inferred Resources |
5.3 |
6.40 |
0.69 |
Notes:
- The independent and qualified person for the mineral resource estimate, as defined by NI 43-101, is Tim Horner, P.Geo. from DMT Consulting Limited.
- CIM definitions were followed for Mineral Resources.
- Mineral Resources are estimated at a cut-off grade of 6% P2O5 in the Residuum or 0.2% Nb2O5 in the Lateritic Material.
- Mineral Resources are estimated at a dry Bulk Density of 1.89 t/m3, 1.70 t/m³, 1.90 t/m³, 2.12 t/m³ for till, laterite, Residuum and carbonatite respectively.
- Mineral Resources are constrained by a Whittle open pit shell.
- A minimum mineralisation width of five metres was used for Indicated Resources and two metres for Inferred Resources.
- Values for tonnage and grade may not add up due to rounding.
Cautionary Note: Mineral resources that are not mineral reserves do not have demonstrated economic viability. The PEA includes Inferred mineral resources that are considered too speculative geologically to have the economic considerations applied to them that would enable them to be categorized as mineral reserves, and there is no certainty that the PEA will be realized. The foregoing mineral resource estimates are as at December 31, 2021. For more information with respect to the data verification procedures undertaken and the key assumptions, parameters and risks associated with the foregoing estimates, refer to Fox River Resources Technical Report entitled "Martison Phosphate PEA" dated effective April 21, 2022 which will be filed on or before June 5, 2022.
Mine Plan and Infrastructure
The Anomaly A deposit is amenable to a large scale, conventional open pit mining method. The PEA mine plan was designed to provide sufficient Residuum material tonnages and grade to meet the demands of the on-site Beneficiation Plant and ensure sufficient concentrate production to the Fertilizer Conversion Complex. Initial site clearing, grubbing and pre-stripping of overburden materials (pre-production) for the open pit and all on-site infrastructure will be performed by a contractor experienced with this type of work in this environment.
The mining operation will transition to an owner-operation during the first year of production mining once all site preparation and pre-production activities have been completed. Waste materials low in P2O5 and Nb2O5 grade will be placed in a designated waste facility or backfilled into the pit towards the end of the Life of Mine. The Lateritic material within the Anomaly A deposit high in Nb2O5 grade will be mined selectively and stockpiled to allow for ease of rehandling, should a viable means of processing this material be implemented in the future.
The mine site will consist of the infrastructure required to support a long life, open pit, truck and shovel operation. The mining activity will utilize 181 tonne haulage trucks and 22 m3 shovels sufficient to meet the mine production requirements. The overall pit wall slopes will be established at a nominal 23 degrees assuming adequate mitigation measures, such as slope depressurization and toe buttressing.
The Martison Mine production schedule is provided below in Figure 3.
Figure 3: Martison Mine Production Schedule
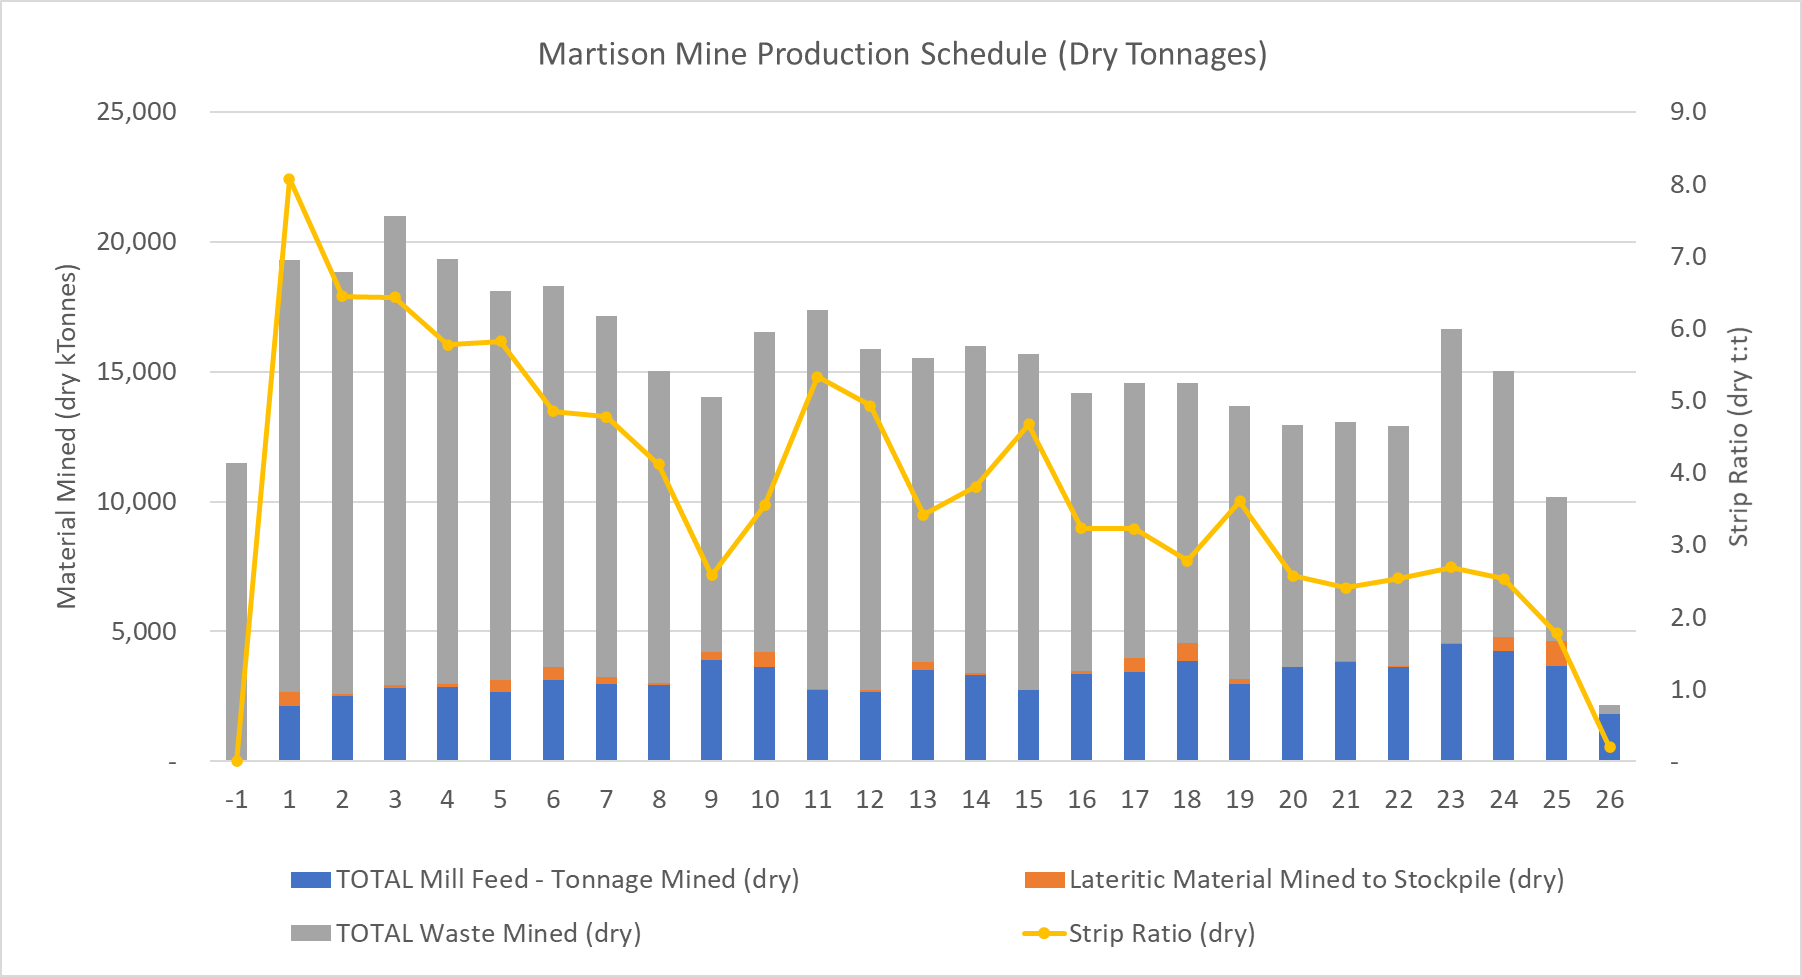
Table 7 – PEA Key Mine Production Parameters
| Parameter |
Units |
Values |
| Mine Life |
years |
26 |
| Mined Mineralized Material |
Mt/dry |
83.61 |
| Beneficiation Plant Average Feed Rate |
T/d (dry) |
8,930 |
| Beneficiation Plant Average Feed Grade |
% P2O5 |
21.48 |
| Concentrate Grade |
% P2O5 |
37.28 |
| Strip Ratio (LOM) |
Waste:Mill Feed (Dry) |
3.90 |
| P2O5 Recovery To The Concentrate |
% |
73.00 |
Beneficiation Plant
The Beneficiation Plant, located at the mine site, converts the mill feed into a concentrate and mine tailings. The processing steps include crushing, milling, size classification to reject fine waste, low intensity and high intensity magnetic separation to reject magnetic waste, and column flotation to produce a high-grade phosphate concentrate. The concentrate is ground and transported by a slurry pipeline to the FCC where it converted to liquid and granular fertilizer products.
Road Corridor and Slurry Pipeline
An all-season access road will be constructed from the north extent of the existing Fushimi Road connecting to Highway 11 (the TransCanada Highway). The existing road will need surface upgrades and widening in sections to support consistent use by heavy industrial equipment. The new road section will be established directly on the existing muskeg and will consist of a geotextile layer overlain by layers of engineered compact fill.
Permanent power to the mine site will be provided through a 115kV transmission line which will be constructed in the access road corridor. This line will connect directly to the main supply at Highway 11 and will be established to the FCC and then extended to the mine site. This will enable grid connection for the FCC as ell as provide the means for the excess power from the FCC to be delivered to the mine site. Step down transformers will be constructed at the FCC and mine site to distribute the power to the infrastructure at both locations.
A slurry pipeline will also be constructed and buried along the road corridor to convey concentrate from the beneficiation plant located at the mine site to the FCC for further processing. This line will have continuous flow rate monitoring and alarm systems installed as part of the construction.
All road improvements and the extension will be required as the first activity for the project construction phase.
Fertilizer Conversion Complex
The Martison project incorporates an integrated FCC located west of Hearst and 86 km south of the mine site, where the finished fertilizer products are produced in specialized operating plants. The siting of this complex is ideally placed in close proximity to the TransCanada highway, an existing rail line and a supply of natural gas and primary grid power. The FCC converts the raw materials (primarily sulfur, ammonia, and the phosphate concentrate) into the finished products.
The FCC infrastructure includes an extensive rail yard to bring in raw materials and ship out products, internal access roads, warehousing and load out facilities, and administrative support buildings. Each of the processing plants has a specific function.
The sulfur conversion plant consumes sulfur obtained from western Canada, producing intermediate products for use in other units, while also generating electricity to power the entire FCC and providing pressurized steam for use in the other units as well.
Adjacent to the sulfur conversion plant is the phosphoric acid plant (PAP) which processes the phosphate concentrate slurry arriving via the pipeline, producing phosphoric acid and gypsum. The phosphoric acid is clarified for further conversion to fertilizer products. Gypsum is converted into a slurry and pumped to an area near the FCC where it will be dewatered and sequestered.
Super-phosphoric acid (SPA) is also produced as a product at the FCC in a separate unit. In this process, concentration and clarification purifies the acid, providing concentrated liquid SPA which can be shipped to customers by rail tank car.
Finally, the granulation unit at the FCC produces mono-ammonium phosphate fertilizer (MAP) as well as a nitrogen-phosphate-sulfur based fertilizer product (NPS) which contains 10% sulfur and 1% micronutrient zinc. The main feedstocks are ammonia which is brought in by rail, and phosphoric acid from the adjacent plant. The granular products are shipped to customer sites by rail hopper cars and truck.
Product Mix and Market Overview
Canada is a growth market that few have noticed. Overall phosphate shipments increased at a compound annual growth rate of more than 6% during the last decade. The Prairie Provinces accounted for most of the growth, and MAP and NPS products captured the majority share of this gain due mainly to soil types and crop mix.
Following the closure of the Nutrien Redwater facility in early 2019, Canada now relies on imports of finished products for all of its phosphate needs. The combination of outstanding demand growth and the closure of the Redwater facility has resulted in a spectacular increase in imports. Canadian MAP/NPS/DAP imports increased from less than 700,000 tonnes at the beginning of the last decade to 2.43 million tonnes for the fertilizer year that ended on June 30, 2021, an increase of 1.7 million tonnes.
Higher agricultural commodity prices coupled with a drive — led by young progressive farmers — to boost productivity are fueling the increase in phosphate use. Demand is projected to continue to grow moderately due to modest gains in planted area and continued trend yield growth. As a consequence, more of the Martison output is expected to ship to freight-advantaged Canadian provinces over time.
Demand drivers continue to look positive as a result of dangerously tight global grain and oil markets today as well as potential demand boosters during the next few years such as the development of a large U.S. renewable diesel and sustainable aviation fuel industry, growing Chinese feed grain import demand, and the increased use of lithium iron phosphate batteries in electric vehicles.
On the supply side of the ledger, the prospect of permanently lower Chinese export supplies is a potential game changer. The world today relies on China for about 10 million tonnes of DAP/MAP exports or almost one-third of global trade of these two leading phosphate products. In addition, recent geopolitical developments likely will restrict exports for the foreseeable future from Russia, an exporter of roughly 10 million tonnes of phosphate products. In the United States, additional plant closures are expected during the next 10 years due to the depletion of phosphate rock reserves or phosphogypsum storage limitations. The expected closures will create an opening for Martison’s phosphate products, especially its high-quality SPA.
The margins used in the financial analysis were derived from a statistical model that forecasts a price of DAP fob New Orleans barge based on values for key raw materials (sulphur and ammonia), the price of corn (as a proxy for agricultural commodity prices and demand), and a phosphoric acid operating rate. Delivered prices to target provinces and states were then derived from historical product and geographical spread relationships.
Three price scenarios were developed based on assumptions for these explanatory variables. The Base Case forecasts are a weighted average of forecasts for the three scenarios. The benchmark margin or difference between the DAP price and the cost of sulphur and ammonia is the key financial driver. One scenario — (”Mean Reversion”) maintains this benchmark margin at the 15-year average. Another more bullish scenario (“Fundamental Change”) assumes a margin roughly $80 per tonne greater than the average while the third scenario (“Green New World”) assumes a margin about $150 per tonne greater than average.
The transportation costs reflected in Table 8 are the same for both Base Case and Current Case scenarios. The costs include both current rail rate and lease car cost estimates.
Table 8 – Average Annual Transportation Costs
| Average Annual Transportation Costs |
| Product |
Unit |
Cost |
| MAP |
t/product |
$47 |
| SPA |
t/product |
$71 |
| NPS |
t/product |
$47 |
| Sulfur |
t/product |
$67 |
| Ammonia |
t/product |
$102 |
Carbon Neutrality, Environmental, Social and Governance
Fox River will be resolute in the effort to operate a Project for the future through the targeting of carbon emissions neutrality and creating a sustainable asset for local communities in a decarbonized world. The ability to provide electricity to both sites using cogenerated power will put Martison in an advantageous position to deliver on carbon emission targets. Additionally, the use of alternative fuels, such as renewable diesel blends, to mitigate both on-site and lifecycle GHG emissions will be pursued.
The company will continue to strive to be grateful, respectful, and ensure a collaborative relationship with our local communities, recognizing that this is essential in creating long-term mutually beneficial success. As the project proceeds, there will be a focus on education and training of local people to provide employment opportunities and build transferable skills.
Contingences & Owner’s Costs
The CAPEX Contingency of $250.0M equates to 15.5% of the sum of total constructed cost and owner’s costs.
Owner’s Costs were estimated to be $76.6M (5% of the total constructed cost). The owner’s costs are intended for pre-production activities such as studies, detail engineering, purchasing, construction, and start up (operational readiness), plus expenditures for first fills and spare parts.
Escalation
All figures are not escalated.
Opportunities
A number of key opportunities for further enhancement of the Martison project have been identified. The most impactful include the following:
- Resource expansion through further exploration of Anomaly A and Anomaly B.
- Feasible economic recovery of niobium resources, both in the stockpiled lateritic material and the phosphate tailings.
- Investigation of the economics for the Martison Project to build and manufacture its own supply of Green Ammonia utilizing a run of river power source.
- A reduction in reagent costs in the beneficiation process.
- Potential improvements to pit wall slope angles following additional sub-surface geotechnical and hydrogeological analyses to reduce stripping ratios as well as mitigate site disturbance.
- Develop and determine the economic use for gypsum which is created as a by-product in the FCC.
Glossary of Terms and Abbreviations
| CAPEX |
Capital Estimate |
LOP |
Life of Project |
PAP |
Phosphoric Acid Plant |
| DAP |
Diammonium Phosphate |
MAP |
Monoammonium Phosphate |
PEA |
Preliminary Economic Assessment |
| FOB |
Freight On Board |
MRE |
Mineral Resource Estimate |
REE |
Rare Earth Element |
| FX |
Exchange Rate |
Mt |
Tonnes (millions) |
SPA |
Super Phosphoric Acid 68% P2O5 |
| GHG |
Greenhouse Gas |
MW |
Megawatt |
SUSEX |
Sustaining Capital Estimate |
| FCC |
Fertilizer Conversion Complex |
NPS |
Nitrogen, Phosphate and Sulfur |
t |
Tonne |
| IRR |
Internal Rate of Return |
NPV |
Net Present Value |
TAM |
Total Addressable Market |
| LOM |
Life of Mine |
OPEX |
Operating Cost Estimate |
|
|
Qualified Persons
The Mineral Resource Estimate was prepared in accordance with Canadian Institute of Mining Metallurgy, and Petroleum (CIM) Definition Standards for Mineral Resources and Mineral Reserves (May 10, 2014), and CIM Estimation of Mineral Resources and Mineral Reserves Best Practice Guidelines (November 29, 2019) and was completed and validated by DMT Consulting Limited. The Mineral Resource Estimate was verified by Mr. Tim Horner, P.Geo. and Associate Consultant of DMT Ltd. Mr. Horner is an independent Qualified Person as defined in NI 43-101 and has consented to applicable disclosure contained herein regarding the Mineral Resource Estimate.
The scientific and technical information disclosed in this press release has been reviewed and approved by Mr. Stephen Ball, P.Eng. of Hatch Ltd., Mr. David Ivell, C.Eng. of JESA Technologies LLC, Mr. Tim Horner, P.Geo. of DMT Consulting Limited, Mr. Kelly Snyder, P. Eng. of Ausenco Inc., and Mr. Ken Armstrong, P.Eng. of Chemetics Inc., each of whom is a “Qualified Person” as such term defined in National Instrument 43-101 – Standards of Disclosure for Mineral Projects (collectively, the “QPs”). Each of the QPs are independent of Fox River.
Technical Report
A Technical Report prepared in accordance with NI 43-101 for the Martison Phosphate Project PEA will be filed on SEDAR (www.sedar.com) on or before June 5, 2022. Readers are encouraged to read the Technical Report in its entirety, including all qualifications, assumptions and exclusions that relate to the Mineral Resource. The Technical Report is intended to be read as a whole, and sections should not be read or relied upon out of context.
ABOUT FOX RIVER
Fox River owns a 100% interest in the Martison Phosphate Project, located near Hearst, Ontario. Martison has a Mineral Resource Estimate with an effective date of December 31, 2021. Martison’s Anomaly A Residuum contains 53.8 million tonnes of Indicated Resources grading 22.99% P2O5 and 0.42% Nb2O5 and 128.3 million tonnes of Inferred Resources grading 17.09% P2O5 and 0.42% Nb2O5. Additional information can be found at www.fox-river.ca or under Fox River’s profile on SEDAR.
For further information, please contact:
Stephen D. Case
President & Chief Executive Officer
Tel: (416) 972-9222
www.fox-river.ca
Neither the Canadian Securities Exchange nor its Regulation Services Provider (as that term is defined in the policies of the Exchange) accepts responsibility for the adequacy or accuracy of this release.
Forward-Looking Statements
Certain information set forth in this news release may contain forward-looking statements that involve substantial known and unknown risks and uncertainties, including, but not limited to, exploration results, potential mineralization, statements relating to mineral resources, and the Company’s plans with respect to the exploration and development of its properties. These forward-looking statements are subject to numerous risks and uncertainties, certain of which are beyond the control of Fox River Resources Corporation, including, but not limited to, the impact of general economic conditions, industry conditions, volatility of commodity prices, risks associated with the uncertainty of exploration results and estimates, currency fluctuations, dependency upon regulatory approvals, the uncertainty of obtaining additional financing, exploration risk and Covid-19 pandemic related orders. Readers are cautioned that the assumptions used in the preparation of such information, although considered reasonable at the time of preparation, may prove to be imprecise and, as such, undue reliance should not be placed on forward-looking statements.
Images accompanying this announcement are available at
https://www.globenewswire.com/NewsRoom/AttachmentNg/299b1376-7d3f-4c60-a4a4-7e52fd4b83a4
https://www.globenewswire.com/NewsRoom/AttachmentNg/efda8fe7-cd80-4aa2-9abc-6452388d586a
https://www.globenewswire.com/NewsRoom/AttachmentNg/8cb5cedc-0b0c-41f6-a275-7142b07fc1fc