This press release contains forward-looking information that is based upon assumptions and is subject to risks and uncertainties as indicated in the cautionary note contained within this press release. All dollar amounts are in U.S. dollars.
DREAM RESIDENTIAL REAL ESTATE INVESTMENT TRUST (TSX: DRR.U) (“Dream Residential REIT” or the “REIT” or “we” or “us”) today announced its financial results for the quarter ended June 30, 2022. Unless otherwise noted, all references to results for the quarter ended June 30, 2022 (“Q2 2022”), reflect the period from May 6, 2022, the date on which the REIT completed its initial public offering (“IPO”) of trust units, to June 30, 2022. All amounts presented are in U.S. dollars. Management will host a conference call to discuss the financial results on August 4, 2022 at 9:30 a.m. (ET).
This press release features multimedia. View the full release here: https://www.businesswire.com/news/home/20220803005889/en/
(Graphic: Business Wire)
HIGHLIGHTS
- For the period ended June 30, 2022, net income was $84.8 million, which comprises net rental income of $4.1 million, fair value adjustments to investment properties of $44.7 million, primarily due to fair value gains on the Initial Portfolio (as defined below) and fair value adjustments to financial instruments of $38.4 million, primarily from the revaluation of Class B units of DRR Holdings LLC, a subsidiary of the REIT (“Class B Units”). Partially offsetting these items were cumulative other income and expenses of $(2.4) million.
- Diluted funds from operations (“FFO”)1 per Unit was $0.09.
- Net operating income (“NOI”)2 was $3.5 million in Q2 2022.
- NOI margin3 for the quarter was 52.2%.
- Average monthly rent as at June 30, 2022 was $1,018 per unit compared to $959 per unit at December 31, 2021, an increase of 6.2% year-to-date.
- Portfolio occupancy was 95.2% as of June 30, 2022 with Greater Oklahoma City at 95.9%, Dallas-Fort Worth at 92.7% and Greater Cincinnati at 97.0%.
- Total assets were $429.3 million as at June 30,2022, comprised primarily of $410.3 million of investment properties and $15.7 million of cash and cash equivalents.
- Total equity (per condensed consolidated financial statements) was $194.3 million as at June 30, 2022.
- Net asset value (“NAV”)4 per Unit was $14.43 as at June 30, 2022.
- Net total debt-to-net total assets5 was 29.1% as at June 30, 2022.
- The REIT established a monthly distribution of $0.035 per Unit, representing $0.42 per Unit on an annualized basis. The REIT declared distributions totaling $0.0644 per Unit during Q2 2022.
1 Diluted FFO per Unit is a non-GAAP ratio. This is not a standardized financial measure under IFRS and might not be comparable to similar measures disclosed by other issuers. Diluted FFO per Unit is comprised of FFO (a non-GAAP financial measure) divided by the weighted average number of Units. For further information on this non-GAAP ratio, please refer to the statements under the heading “Non-GAAP financial measures, ratios and supplementary financial measures” in this press release.
2 Net operating income (“NOI”) is a non-GAAP financial measure. This is not a standardized financial measure under IFRS and might not be comparable to similar measures disclosed by other issuers. The most directly comparable financial measure to NOI is net rental income. The tables included in the Appendices section of this press release reconcile NOI for the period from May 6, 2022 to June 30, 2022 to net rental income. For further information on this non-GAAP financial measure, please refer to the statements under the heading “Non-GAAP financial measures, ratios and supplementary financial measures” in this press release.
3 NOI margin is a non-GAAP ratio. This is not a standardized financial measure under IFRS and might not be comparable to similar measures disclosed by other issuers. NOI margin is defined as NOI (a non-GAAP financial measure) divided by investment properties revenue, as a percentage. For further information on this non-GAAP ratio, please refer to the statements under the heading “Non-GAAP financial measures, ratios and supplementary financial measures” in this press release.
4 NAV per Unit is a non-GAAP ratio. This is not a standardized financial measure under IFRS and might not be comparable to similar measures disclosed by other issuers. NAV per Unit is comprised of total equity (including Class B Units) (a non-GAAP financial measure) divided by the number of Units. For further information on this non-GAAP ratio, please refer to the statements under the heading “Non-GAAP financial measures, ratios and supplementary financial measures” in this press release.
5 Net total debt-to-net total assets is a non-GAAP ratio. This is not a standardized financial measure under IFRS and might not be comparable to similar measures disclosed by other issuers. Net total debt-to-net total assets ratio is comprised of net total debt (a non-GAAP financial measure) divided by net total assets (a non-GAAP financial measure). For further information on this non-GAAP ratio, please refer to the statements under the heading “Non-GAAP financial measures, ratios and supplementary financial measures” in this press release.
|
FINANCIAL HIGHLIGHTS
|
|
As at
|
|
(unaudited) (in thousands unless otherwise stated)
|
|
June 30, 2022
|
|
Operating results
|
|
|
|
Net income
|
$
|
84,825
|
|
Funds from operations (FFO)(1)
|
|
1,868
|
|
Net rental income
|
|
4,050
|
|
Net operating income (NOI)(11)
|
|
3,516
|
|
Per unit amounts
|
|
|
|
Distribution rate per Trust Unit
|
$
|
0.035
|
|
Diluted FFO per Unit(2)(3)
|
$
|
0.09
|
See footnotes at end
|
PORTFOLIO INFORMATION
|
|
As at
|
|
(unaudited)
|
|
June 30, 2022
|
|
Total portfolio
|
|
|
|
Number of assets
|
|
16
|
|
Investment properties fair value (in thousands)
|
|
$410,300
|
|
Rental units
|
|
3,432
|
|
Occupancy rate - in place (period-end)
|
|
95.2%
|
|
Average in-place base rent per unit
|
|
$1,018
|
|
Estimated market rent to in-place base rent spread (%) (period-end)
|
|
7.6%
|
|
Retention rate (period-end)
|
|
66.7%
|
“Our portfolio performance was consistent with our expectations during the second quarter,” said Jane Gavan, Chief Executive Officer of Dream Residential REIT. “We continue to see strong fundamentals in our primary markets and are well positioned to deliver attractive growth as we head into our IPO Forecast for the 12-month period ending June 30, 2023.”
ORGANIC GROWTH
Dream Residential REIT achieved strong organic growth across the portfolio, capturing rental rate growth in its primary markets, while making progress on implementing its value-add initiatives. The REIT continues to maintain a conservative balance sheet, which will provide flexibility in our capital allocation decisions.
Weighted average monthly rent as at June 30, 2022 was $1,018 per unit, representing a 6.2% increase from December 31, 2021. Rental rate increases were robust across all of the REIT’s primary markets including Greater Oklahoma City at 6.3%, Greater Dallas Fort-Worth at 6.5% and Greater Cincinnati at 5.9%.
Leasing momentum was strong in Q2 2022 with blended lease trade outs averaging 13.4%, comprised of an average increase on new leases of approximately 21.4% and an average increase on renewals of approximately 9.5%. At June 30, 2022, estimated market rents were $1,095 per unit, or an average gain-to-lease for the portfolio of 7.6%. The REIT intends to achieve strong rental rate growth over time as it sets rents on expiring leases to market.
Value-Add Initiatives
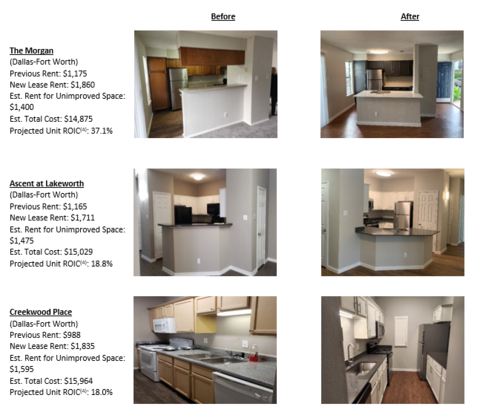
The REIT commenced its value-add initiatives in Q2 2022. As of June 30, 2022, renovations were completed on 24 suites across three properties in Greater Dallas-Fort Worth. An additional 12 suites are currently under renovation across all four properties in this region. The average cost per suite was approximately $12,000 and projected unit return on invested capital (“ROIC”)(4) is in line with management’s target of 12-16%. In July, the REIT commenced its value-add program in Greater Oklahoma City.
See photo above for examples of our recent value-add initiatives in the Dallas-Fort Worth region.
“We are pleased with the initial results of the value-add program which will be a core part of the REIT’s organic growth over time,” said Scott Schoeman, Chief Operating Officer of Dream Residential REIT. “We have made good progress on our value-enhancing renovations in the Dallas-Fort Worth region and commenced work in the Oklahoma region in July. We believe that our program will be a strong driver of NAV and FFO growth.”
FINANCING AND CAPITAL INFORMATION
|
(unaudited)
|
|
As at
|
|
|
|
June 30, 2022
|
|
Financing
|
|
|
|
Net total debt-to-net total assets(5)
|
|
29.1%
|
|
Average term to maturity on debt (years)
|
|
6.1
|
|
Interest coverage ratio (times)(6)
|
|
3.2
|
|
Undrawn credit facilities (in thousands)
|
$
|
70,000
|
|
Available liquidity(7) (in thousands)
|
$
|
85,714
|
|
Capital
|
|
|
|
Total equity (excluding Class B Units) (in thousands)
|
$
|
194,305
|
|
Total equity (including Class B Units) (in thousands)(8)
|
$
|
285,437
|
|
Total number of Trust Units and Class B Units (in thousands)(9)
|
|
19,788
|
|
Net asset value (NAV) per Unit(10)
|
$
|
14.43
|
|
Unit price
|
$
|
9.15
|
As of June 30, 2022, net total debt-to-net total assets was 29.1%, below the lower end of the REIT’s target leverage of 35%-45%. The REIT’s debt comprises 12 fixed rate mortgages with a face value of $144.2 million and a weighted average contractual interest rate of 3.95% (fair value of $136.1 million and effective interest rate of 5.20%). There are no mortgage maturities until 2025. The REIT ended Q2 2022 with total available liquidity of approximately $85.7 million(7), comprised of $15.7 million of cash and cash equivalents and $70 million of availability on its undrawn revolving credit facility.
“The REIT is in a strong financial position heading into the second half of the year,” said Derrick Lau, Chief Financial Officer of Dream Residential REIT. “With a conservative balance sheet and ample liquidity, the REIT is well positioned against increasing interest rates and inflationary pressures. In addition, the REIT has financial flexibility to execute on its strategic initiatives to create value for unitholders, including continued investment in our value-add program.”
CONFERENCE CALL
Senior management will host a conference call to discuss the financial results on Thursday, August 4, 2022, at 9:30 a.m. (ET). To access the conference call, please dial 1-866-455-3403 in Canada or 647-484-8332 elsewhere and use passcode 69215822#. To access the conference call via webcast, please go to Dream Residential REIT’s website at www.dreamresidentialreit.ca and click on the link for News, then click on Events. A taped replay of the conference call and the webcast will be available for ninety (90) days following the call.
OTHER INFORMATION
Information appearing in this press release is a select summary of financial results. The condensed consolidated financial statements and management’s discussion and analysis for the REIT will be available at www.dreamresidentialreit.ca and under the REIT’s profile on www.sedar.com.
Dream Residential REIT is a newly created, unincorporated, open-ended real estate investment trust established and governed by the laws of the Province of Ontario. The REIT owns an initial portfolio (the “Initial Portfolio”) of 16 garden-style multi-residential properties, consisting of 3,432 units primarily located in three markets across the Sunbelt and Midwest regions of the United States. For more information, please visit www.dreamresidentialreit.ca.
Non-GAAP financial measures, ratios and supplementary financial measures
The REIT’s condensed consolidated financial statements are prepared in accordance with International Financial Reporting Standards (“IFRS”). In this press release, as a complement to results provided in accordance with IFRS, the REIT discloses and discusses certain non-GAAP financial measures and ratios, including FFO, diluted FFO per Unit, NOI, NOI margin, total debt, net total debt-to-net total assets ratio, adjusted EBITDAFV ratio, interest coverage ratio (times), available liquidity, total equity (including Class B Units) and NAV per Unit as well as other measures discussed elsewhere in this press release. These non-GAAP financial measures and ratios are not defined by IFRS and do not have a standardized meaning under IFRS. The REIT’s method of calculating these non-GAAP financial measures and ratios may differ from other issuers and may not be comparable with similar measures presented by other income trusts. The REIT has presented such non-GAAP financial measures and ratios as Management believes they are relevant measures of the REIT’s underlying operating and financial performance. Certain additional disclosures such as the composition, usefulness and changes, as applicable, of the non-GAAP financial measures and ratios included in this press release have been incorporated by reference from the management’s discussion and analysis of the financial condition and results from operations of the REIT for the period from May 6, 2022 to June 30, 2022, dated August 3, 2022 (the “MD&A for the second quarter of 2022”) and can be found under the sections “Non-GAAP Financial Measures and Ratios" and respective sub-headings labelled “Funds from operations (“FFO”)”, “NAV per Unit”, "Net operating income (“NOI”) and NOI Margin”, “Adjusted earnings before interest, taxed, depreciation, amortization and fair value adjustments (Adjusted EBITDAFV)”, “Available Liquidity”, “Total equity (including Class B Units)”, “Interest coverage ratio (times)” and “Net total debt-to-net total assets” )". The composition of supplementary financial measures included in this press release have been incorporated by reference from the MD&A for the second quarter of 2022 and can be found under the section “Supplementary Financial Measures and Other Disclosures”. The MD&A for the second quarter of 2022 is available on SEDAR at www.sedar.com under the REIT’s profile and on the REIT’s website at www.dreamresidentialreit.ca under the Investors section. Non-GAAP financial measures and ratios should not be considered as alternatives to net income, net rental income, cash flows generated from (utilized in) operating activities, cash and cash equivalents, total assets, non-current debt, total equity, or comparable metrics determined in accordance with IFRS as indicators of the REIT’s performance, liquidity, cash flow, and profitability.
Forward-Looking Information
This press release may contain forward-looking information within the meaning of applicable securities legislation. Such information includes statements regarding our intentions to implement our value-enhancing renovation initiatives at our properties and our expectations with respect to our forecasted FFO, NAV and FFO growth. Forward-looking information generally can be identified by the use of forward-looking terminology such as “will”, “expect”, “believe”, “plan”, or “continue”, or similar expressions suggesting future outcomes or events. Forward looking information is based on a number of assumptions and is subject to a number of risks and uncertainties, many of which are beyond Dream Residential REIT’s control that could cause actual results to differ materially from those that are disclosed in or implied by such forward-looking information. These risks and uncertainties include, but are not limited to, global and local economic and business conditions; uncertainties surrounding the COVID-19 pandemic; risks associated with unexpected or ongoing geopolitical events; risks inherent in the real estate industry; financing risks; and interest and currency rate fluctuations. Our objectives and forward-looking statements are based on certain assumptions, including that the general economy remains stable, there are no unforeseen changes in the legislative and operating framework for our business, we will have access to adequate capital to fund our future projects and plans and that we will receive financing on acceptable terms; interest rates remain stable and geopolitical events will not disrupt global economies. All forward-looking information in this press release speaks as of the date of this press release. Dream Residential REIT does not undertake to update any such forward-looking information whether as a result of new information, future events or otherwise except as required by law. Additional information about these assumptions and risks and uncertainties is contained in Dream Residential REIT’s final long-form prospectus dated April 29, 2022, including under the heading “Risk Factors” therein.
FOOTNOTES
(1) FFO is a non-GAAP financial measure. This is not a standardized financial measure under IFRS and might not be comparable to similar measures disclosed by other issuers. The most directly comparable financial measure to FFO is net income. For further information on this non-GAAP measure, please refer to the statements under the heading “Non-GAAP financial measures, ratios and supplementary financial measures” in this press release. The table included in Appendices section of this press release reconcile FFO for period from May 6, 2022 to June 30, 2022 to net income.
(2) Diluted FFO per Unit is a non-GAAP ratio. This is not a standardized financial measure under IFRS and might not be comparable to similar measures disclosed by other issuers. Diluted FFO per Unit is comprised of FFO (a non-GAAP financial measure) divided by the weighted average number of Units. For further information on this non-GAAP ratio, please refer to the statements under the heading “Non-GAAP financial measures, ratios and supplementary financial measures” in this press release.
(3) A description of the determination of diluted amounts per Unit can be found in the REIT’s Management’s Discussion and Analysis for the period ended June 30, 2022, in the section “Supplementary Financial Measures and Other Disclosures”, under the heading “Weighted average number of Units”.
(4) Return on invested capital is a non-GAAP ratio. This is not a standardized financial measure under IFRS and might not be comparable to similar measures disclosed by other issuers. Return on invested capital is calculated as the difference in new lease rent compared to estimated rent on unimproved space divided by estimated total cost. For further information on this non-GAAP ratio, please refer to the statements under the heading “Non-GAAP financial measures, ratios and supplementary financial measures” in this press release.
(5) Net total debt-to-net total assets ratio is a non-GAAP ratio. This is not a standardized financial measure under IFRS and might not be comparable to similar measures disclosed by other issuers. Net total debt-to-net total assets ratio is comprised of net total debt (a non-GAAP financial measure) divided by net total assets (a non-GAAP financial measure). For further information on this non-GAAP ratio, please refer to the statements under the heading “Non-GAAP financial measures, ratios and supplementary financial measures” in this press release.
(6) Interest coverage ratio (times) is a non-GAAP ratio. This is not a standardized financial measure under IFRS and might not be comparable to similar measures disclosed by other issuers. Interest coverage ratio is comprised adjusted EBITDAFV (a non-GAAP financial measure) divided by interest expense on debt. For further information on this non-GAAP ratio, please refer to the statements under the heading “Non-GAAP financial measures and ratios and supplementary financial measures” in this press release.
(7) Available liquidity is a non-GAAP financial measure. This is not a standardized financial measure under IFRS and might not be comparable to similar measures disclosed by other issuers. The most directly comparable financial measure to available liquidity is cash and cash equivalents. The table included in the Appendices section of this press release reconcile available liquidity to cash and cash equivalents as at June 30, 2022. For further information on this non-GAAP measure, please refer to the statements under the heading “Non-GAAP financial measures, ratios and supplementary financial measures” in this press release.
(8) Total equity (including Class B Units) is a non-GAAP financial measure. This is not a standardized financial measure under IFRS and might not be comparable to similar measures disclosed by other issuers. The most directly comparable financial measure to available liquidity is total equity. For further information on this non-GAAP measure, please refer to the statements under the heading “Non-GAAP financial measures, ratios and supplementary financial measures” in this press release. The table included in Appendices section of this press release reconciles total equity (including Class B Units) to total equity as at June 30, 2022.
(9) Total number of Units includes 9,827,791 Trust Units and 9,959,830 Class B Units that are classified as a liability under IFRS.
(10) NAV per Unit is a non-GAAP ratio. This is not a standardized financial measure under IFRS and might not be comparable to similar measures disclosed by other issuers. NAV per Unit is comprised of total equity (a non-GAAP financial measure) divided by the number of Units. For further information on this non-GAAP ratio, please refer to the statements under the heading “Non-GAAP financial measures, ratios and supplementary financial measures” in this press release.
(11) NOI is a non-GAAP financial measure. This is not a standardized financial measure under IFRS and might not be comparable to similar measures disclosed by other issuers. The most directly comparable financial measure to NOI is net rental income. The table included in the Appendices section of this press release reconciles NOI for the period from May 6, 2022 to June 30, 2022 to net rental income. For further information on this non-GAAP financial measure, please refer to the statements under the heading “Non-GAAP financial measures, ratios and supplementary financial measures” in this press release.
Appendices
Reconciliation of FFO to net income
The table below reconciles FFO for the period from May 6, 2022 to June 30, 2022 to net income.
|
|
|
|
Period from May 6, 2022
|
|
(in thousands of dollars)
|
|
|
|
|
|
|
|
|
to June 30, 2022
|
|
Net income for the period
|
|
|
|
|
|
|
|
$
|
84,825
|
|
Add (deduct):
|
|
|
|
|
|
|
|
|
|
|
Fair value adjustments to investment properties
|
|
|
|
|
|
|
|
|
(44,683)
|
|
Fair value adjustments to financial instruments
|
|
|
|
|
|
|
|
|
(38,381)
|
|
IFRIC 21 adjustment
|
|
|
|
|
|
|
|
|
(534)
|
|
Interest expense on Class B Units
|
|
|
|
|
|
|
|
|
641
|
|
FFO for the period before the undernoted adjustment
|
|
|
|
|
|
|
|
|
1,868
|
|
Diluted weighted average number of units
|
|
|
|
|
|
|
|
|
19,805,506
|
|
FFO for the period
|
|
|
|
|
|
|
|
$
|
0.09
|
Reconciliation of NOI to total investment property revenue
The table below reconciles NOI to total investment property revenue for the period from May 6, 2022 to June 30, 2022:
|
|
|
|
Period from May 6, 2022
|
|
(in thousands of dollars)
|
|
|
|
|
|
|
|
|
to June 30, 2022
|
|
Investment properties revenue
|
|
|
|
|
|
|
|
$
|
6,742
|
|
Property operating expenses
|
|
|
|
|
|
|
|
|
(2,692)
|
|
Total
|
|
|
|
|
|
|
|
|
4,050
|
|
Property tax liability adjustment (IFRIC 21)
|
|
|
|
|
|
|
|
|
(534)
|
|
Net operating income (NOI)
|
|
|
|
|
|
|
|
|
3,516
|
Reconciliation of available liquidity to cash and cash equivalents
The table below reconciles available liquidity to cash and cash equivalents as at June 30, 2022:
|
(in thousands of dollars)
|
|
|
|
|
|
|
|
As at June 30, 2022
|
|
Cash and cash equivalents
|
|
|
|
|
|
|
|
$
|
15,714
|
|
Undrawn credit facilities
|
|
|
|
|
|
|
|
|
70,000
|
|
Available liquidity
|
|
|
|
|
|
|
|
|
85,714
|
Reconciliation of total equity (including Class B Units) to total equity
The table below reconciles total equity (including Class B Units) to total equity as at June 30, 2022:
|
|
As at June 30, 2022
|
|
(in thousands of dollars, except number of Units)
|
Units
|
Amount
|
|
Total equity per consolidated financial statements
|
|
9,827,791
|
$
|
194,305
|
|
Add: Class B Units
|
|
9,959,830
|
|
91,132
|
|
Total equity (including Class B Units)
|
|
19,787,621
|
$
|
285,437
|
Reconciliation of total equity (including Class B Units) to total equity
|
|
As at June 30, 2022
|
|
(in thousands of dollars, except number of Units)
|
Units
|
Amount
|
|
Unitholders’ equity
|
|
9,827,791
|
$
|
110,113
|
|
Retained earnings
|
|
-
|
|
84,192
|
|
Accumulated other comprehensive income (loss)
|
|
-
|
|
-
|
|
Total equity per condensed consolidated financial statements
Add: Class B Units
|
|
9,827,791
9,959,830
|
$
|
194,305
91,132
|
|
Total equity (including Class B Units)
|
|
19,787,621
|
$
|
285,437
|
|
NAV per Unit
|
|
|
$
|
14.43
|
Reconciliation of Net total debt-to-Net total assets to investment properties revenue
|
|
As at June 30, 2022
|
|
(in thousands of dollars)
|
|
Amount
|
|
Mortgages payable
|
|
|
$
|
136,057
|
|
Less: cash and cash equivalents
|
|
|
|
(15,714)
|
|
Net total debt
|
|
|
|
120,343
|
|
Total assets
Less: cash and cash equivalents
|
|
|
$
|
429,284
(15,714)
|
|
Net total assets
|
|
|
$
|
413,570
|
|
Net total debt-to-net total assets
|
|
|
|
29.1%
|

View source version on businesswire.com: https://www.businesswire.com/news/home/20220803005889/en/