--Second Quarter Total Loan Origination Volume Grew 138.4% to RMB13.5 Billion --
--Second Quarter Net Income Grew 100.2% to RMB253.8 Million --
SHANGHAI, China, Aug. 18, 2022 (GLOBE NEWSWIRE) -- Jiayin Group Inc. (“Jiayin” or the “Company”) (NASDAQ: JFIN), a leading fintech platform in China, today announced its unaudited financial results for the second quarter ended June 30, 2022.
Second Quarter 2022 Operational and Financial Highlights:
- Loan origination volume1 was RMB13.5 billion (US$2.0 billion), representing an increase of 138.4% from the same period of 2021.
- Average borrowing amount per borrowing was RMB8,939 (US$1,335), representing an increase of 49.4% from the same period of 2021.
- Repeat borrowing rate2 was 67.8%, compared with repeat borrowing rate of 72.4% in the same period of 2021.
- Net revenue was RMB811.6 million (US$121.2 million), representing an increase of 64.9% from the same period of 2021.
- Income from operations was RMB344.5 million (US$51.4 million), representing an increase of 130.3% from RMB149.6 million in the same period of 2021.
- Net income was RMB253.8 million (US$37.9 million), representing an increase of 100.2% from RMB126.8 million in the same period of 2021.
Mr. Yan Dinggui, the Company’s Founder, Director and Chief Executive Officer, commented: “In the second quarter, we achieved another quarter of strong financial and operational performance as we continue to invest into technology innovation and operational efficiency. The most notable of the second quarter’s financial results is that our net revenue grew by 64.9% while our net income more than doubled year over year. Such strong performance was driven by our ongoing efforts in enhancing our risk management capabilities, optimizing our borrower base, and expanding our partnership network of licensed institutions. Going forward, we are confident that our highly automated platforms, diverse funding sources, and global business will position us well in capitalizing on emerging market opportunities.”
Second Quarter 2022 Financial Results
Net revenue was RMB811.6 million (US$121.2 million), representing an increase of 64.9% from the same period of 2021.
Revenue from loan facilitation services was RMB742.6 million (US$110.9 million), representing an increase of 63.7% from the same period of 2021. The increase was primarily due to the increased loan origination volume from the Company’s institutional funding partners.
Other revenue was RMB69.0 million (US$10.3 million), compared with RMB38.5 million in the second quarter of 2021. The increase was mainly driven by revenue generated from individual investor referral services, partially offset by the ongoing restructuring of the Company's overseas business.
Origination and servicing expense was RMB128.3 million (US$19.2 million), representing an increase of 54.2% from the same period of 2021, driven by the increase in the Company’s loan origination volume.
Allowance for receivables and contract assets was RMB7.0 million (US$1.0 million), representing a decrease of 46.2% from the same period of 2021, primarily due to the ongoing restructuring of the Company's overseas business.
Sales and marketing expense was RMB235.0 million (US$35.1 million), representing an increase of 34.9% from the same period of 2021, primarily due to an increase in borrower acquisition expenses in the second quarter of 2022.
General and administrative expense was RMB42.6 million (US$6.4 million), representing an increase of 21.0% from the same period of 2021, primarily driven by an increase in expenditures in employee compensation and related benefits.
Research and development expense was RMB54.1 million (US$8.1 million), representing an increase of 69.6% from the same period of 2021, primarily due to higher employee compensation and benefit costs as well as increased professional service fees.
Income from operations was RMB344.5 million (US$51.4 million), representing an increase of 130.3% from RMB149.6 million in the same period of 2021.
Net income was RMB253.8 million (US$37.9 million), representing an increase of 100.2% from RMB126.8 million in the same period of 2021.
Cash and cash equivalents were RMB213.9 million (US$31.9 million) as of June 30, 2022, compared with RMB170.3 million as of March 31, 2022.
The following table provides the delinquency rates of all outstanding loans on the Company’s platform in Mainland China as of the respective dates indicated.
|
|
Delinquent for |
| As of |
|
1-30 days |
31-60 days |
61-90 days |
91 -180 days |
More than 180 days |
|
|
(%) |
| December 31, 2018 |
|
1.35 |
2.53 |
2.37 |
5.46 |
9.45 |
| December 31, 2019 |
|
1.27 |
2.20 |
1.68 |
4.79 |
8.39 |
| December 31, 2020 |
|
1.47 |
0.88 |
0.70 |
1.66 |
1.81 |
| December 31, 2021 |
|
1.31 |
0.90 |
0.72 |
1.78 |
2.12 |
| March 31, 2022 |
|
0.78 |
0.74 |
0.53 |
1.61 |
2.69 |
| June 30, 2022 |
|
0.89 |
0.50 |
0.44 |
1.00 |
2.61 |
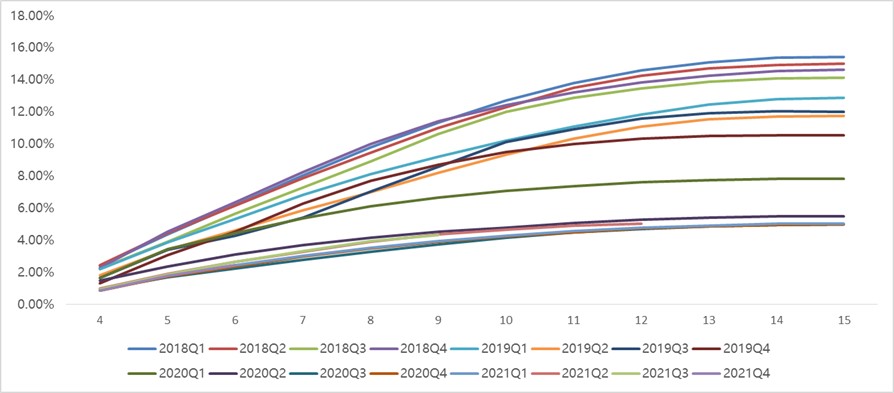
The following chart and table display the historical cumulative M3+ Delinquency Rate by Vintage for loan products facilitated through the Company’s platform in Mainland China.
|
Month on Book |
| Vintage |
4th |
5th |
6th |
7th |
8th |
9th |
10th |
11th |
12th |
13th |
14th |
15th |
| 2018Q1 |
2.41 |
% |
4.38 |
% |
6.21 |
% |
8.05 |
% |
9.80 |
% |
11.35 |
% |
12.71 |
% |
13.80 |
% |
14.61 |
% |
15.10 |
% |
15.38 |
% |
15.44 |
% |
| 2018Q2 |
2.43 |
% |
4.43 |
% |
6.15 |
% |
7.87 |
% |
9.47 |
% |
11.02 |
% |
12.30 |
% |
13.50 |
% |
14.25 |
% |
14.70 |
% |
14.94 |
% |
15.00 |
% |
| 2018Q3 |
2.23 |
% |
3.89 |
% |
5.66 |
% |
7.30 |
% |
8.89 |
% |
10.64 |
% |
12.00 |
% |
12.86 |
% |
13.47 |
% |
13.87 |
% |
14.07 |
% |
14.13 |
% |
| 2018Q4 |
2.26 |
% |
4.53 |
% |
6.38 |
% |
8.25 |
% |
9.99 |
% |
11.40 |
% |
12.44 |
% |
13.22 |
% |
13.83 |
% |
14.25 |
% |
14.53 |
% |
14.64 |
% |
| 2019Q1 |
2.17 |
% |
3.86 |
% |
5.32 |
% |
6.84 |
% |
8.13 |
% |
9.21 |
% |
10.21 |
% |
11.07 |
% |
11.85 |
% |
12.45 |
% |
12.80 |
% |
12.87 |
% |
| 2019Q2 |
1.83 |
% |
3.40 |
% |
4.59 |
% |
5.85 |
% |
6.98 |
% |
8.21 |
% |
9.35 |
% |
10.33 |
% |
11.08 |
% |
11.54 |
% |
11.73 |
% |
11.74 |
% |
| 2019Q3 |
1.64 |
% |
3.41 |
% |
4.26 |
% |
5.42 |
% |
7.03 |
% |
8.60 |
% |
10.13 |
% |
10.94 |
% |
11.59 |
% |
11.92 |
% |
12.04 |
% |
12.01 |
% |
| 2019Q4 |
1.31 |
% |
3.08 |
% |
4.52 |
% |
6.27 |
% |
7.69 |
% |
8.69 |
% |
9.51 |
% |
9.99 |
% |
10.31 |
% |
10.49 |
% |
10.55 |
% |
10.54 |
% |
| 2020Q1 |
1.67 |
% |
3.43 |
% |
4.46 |
% |
5.36 |
% |
6.11 |
% |
6.67 |
% |
7.09 |
% |
7.38 |
% |
7.61 |
% |
7.76 |
% |
7.84 |
% |
7.85 |
% |
| 2020Q2 |
1.46 |
% |
2.37 |
% |
3.11 |
% |
3.68 |
% |
4.14 |
% |
4.52 |
% |
4.80 |
% |
5.08 |
% |
5.27 |
% |
5.42 |
% |
5.49 |
% |
5.51 |
% |
| 2020Q3 |
0.96 |
% |
1.70 |
% |
2.24 |
% |
2.77 |
% |
3.27 |
% |
3.73 |
% |
4.16 |
% |
4.47 |
% |
4.71 |
% |
4.87 |
% |
4.96 |
% |
4.98 |
% |
| 2020Q4 |
0.85 |
% |
1.74 |
% |
2.37 |
% |
3.00 |
% |
3.49 |
% |
3.89 |
% |
4.24 |
% |
4.50 |
% |
4.72 |
% |
4.87 |
% |
4.96 |
% |
4.99 |
% |
| 2021Q1 |
0.96 |
% |
1.83 |
% |
2.45 |
% |
3.04 |
% |
3.51 |
% |
3.95 |
% |
4.28 |
% |
4.56 |
% |
4.78 |
% |
4.93 |
% |
5.01 |
% |
5.03 |
% |
| 2021Q2 |
1.00 |
% |
1.90 |
% |
2.65 |
% |
3.30 |
% |
3.90 |
% |
4.35 |
% |
4.64 |
% |
4.89 |
% |
5.01 |
% |
— |
|
— |
|
— |
|
| 2021Q3 |
0.95 |
% |
1.86 |
% |
2.65 |
% |
3.31 |
% |
3.94 |
% |
4.33 |
% |
— |
|
— |
|
— |
|
— |
|
— |
|
— |
|
| 2021Q4 |
0.84 |
% |
1.78 |
% |
2.43 |
% |
— |
|
— |
|
— |
|
— |
|
— |
|
— |
|
— |
|
— |
|
— |
|
Recent Development
US$10 Million Share Repurchase Plan
On June 13, 2022, the Company’s board of directors authorized a share repurchase plan under which the Company may repurchase its ordinary shares with an aggregate value of US$10 million during the 12-month period beginning on June 13, 2022. As of June 30, 2022, the Company had repurchased approximately 0.2 million American depositary shares for approximately US$0.5 million under this share repurchase plan.
Conference Call
The Company will conduct a conference call to discuss its financial results on Thursday, August 18, 2022 at 8:00 AM U.S. Eastern Time (8:00 PM Beijing/Hong Kong Time on the same day).
To join the conference call, all participants must use the following link to complete the online registration process in advance. Upon registering, each participant will receive access details for this event including the dial-in numbers, a PIN number, and an e-mail with detailed instructions to join the conference call.
Participant Online Registration:https://register.vevent.com/register/BI2ad8bfdc33154a498bfd411d8238d464
A live and archived webcast of the conference call will be available on the Company’s investors relations website at http://ir.jiayin-fintech.com/.
About Jiayin Group Inc.
Jiayin Group Inc. is a leading fintech platform in China committed to facilitating effective, transparent, secure and fast connections between underserved individual borrowers and financial institutions. The origin of the business of the Company can be traced back to 2011. The Company operates a highly secure and open platform with a comprehensive risk management system and a proprietary and effective risk assessment model which employs advanced big data analytics and sophisticated algorithms to accurately assess the risk profiles of potential borrowers. For more information, please visit https://ir.jiayin-fintech.com/.
Exchange Rate Information
This announcement contains translations of certain RMB amounts into U.S. dollars (“US$”) at a specified rates solely for the convenience of the reader. Unless otherwise noted, all translations from RMB to U.S. dollars are made at a rate of RMB6.6981 to US$1.00, the exchange rate set forth in the H.10 statistical release of the Board of Governors of the Federal Reserve System as of June 30, 2022. The Company makes no representation that the RMB or US$ amounts referred could be converted into US$ or RMB, as the case may be, at any particular rate or at all.
Safe Harbor / Forward-Looking Statements
This announcement contains forward-looking statements. These statements are made under the “safe harbor” provisions of the United States Private Securities Litigation Reform Act of 1995. These forward-looking statements can be identified by terminology such as “will,” “expects,” “anticipates,” “future,” “intends,” “plans,” “believes,” “estimates” and similar statements. The Company may also make written or oral forward-looking statements in its periodic reports to the SEC, in its annual report to shareholders, in press releases and other written materials and in oral statements made by its officers, directors or employees to third parties. Statements that are not historical facts, including statements about the Company’s beliefs and expectations, are forward-looking statements. Forward-looking statements involve inherent risks and uncertainties and are based on current expectations, assumptions, estimates and projections about the Company and the industry. Potential risks and uncertainties include, but are not limited to, those relating to the Company’s ability to retain existing investors and borrowers and attract new investors and borrowers in an effective and cost-efficient way, the Company’s ability to increase the investment volume and loan origination of loans volume facilitated through its marketplace, effectiveness of the Company’s credit assessment model and risk management system, PRC laws and regulations relating to the online individual finance industry in China, general economic conditions in China, and the Company’s ability to meet the standards necessary to maintain listing of its ADSs on the Nasdaq Stock Market or other stock exchange, including its ability to cure any non-compliance with the continued listing criteria of the Nasdaq Stock Market. All information provided in this press release is as of the date hereof, and the Company undertakes no obligation to update any forward-looking statements to reflect subsequent occurring events or circumstances, or changes in its expectations, except as may be required by law. Although the Company believes that the expectations expressed in these forward-looking statements are reasonable, it cannot assure you that its expectations will turn out to be correct, and investors are cautioned that actual results may differ materially from the anticipated results. Further information regarding risks and uncertainties faced by the Company is included in the Company’s filings with the U.S. Securities and Exchange Commission, including its annual report on Form 20-F.
For more information, please contact:
In China:
Jiayin Group
Mr. Shawn Zhang
Email: ir@jiayinfintech.cn
or
The Blueshirt Group
Ms. Ally Wang
Email: ally@blueshirtgroup.com
In the U.S.:
Ms. Julia Qian
Email: julia@blueshirtgroup.com
JIAYIN GROUP INC.
UNAUDITED CONDENSED CONSOLIDATED BALANCE SHEETS
(Amounts in thousands, except for share and per share data)
|
|
As of
December 31, |
|
|
As of
June 30, |
|
|
|
2021 |
|
|
2022 |
|
|
|
RMB |
|
|
RMB |
|
|
US$ |
|
| ASSETS |
|
|
|
|
|
|
|
|
|
|
|
|
| Cash and cash equivalents |
|
|
182,551 |
|
|
|
213,883 |
|
|
|
31,932 |
|
| Restricted cash |
|
|
2,016 |
|
|
|
2,019 |
|
|
|
301 |
|
| Amounts due from related parties |
|
|
37,017 |
|
|
|
37,659 |
|
|
|
5,622 |
|
| Accounts receivable and contract assets, net |
|
|
502,431 |
|
|
|
1,115,824 |
|
|
|
166,588 |
|
| Loan receivables, net |
|
|
329 |
|
|
|
1,884 |
|
|
|
281 |
|
| Prepaid expenses and other current assets |
|
|
62,255 |
|
|
|
72,067 |
|
|
|
10,759 |
|
| Deferred tax assets, net |
|
|
48,456 |
|
|
|
85,044 |
|
|
|
12,697 |
|
| Property and equipment, net |
|
|
9,100 |
|
|
|
6,259 |
|
|
|
934 |
|
| Right-of-use assets |
|
|
35,507 |
|
|
|
27,378 |
|
|
|
4,087 |
|
| Long-term investment |
|
|
90,528 |
|
|
|
100,115 |
|
|
|
14,947 |
|
| Other non-current assets |
|
|
1,242 |
|
|
|
1,449 |
|
|
|
216 |
|
| TOTAL ASSETS |
|
|
971,432 |
|
|
|
1,663,581 |
|
|
|
248,364 |
|
| LIABILITIES AND EQUITY |
|
|
|
|
|
|
|
|
|
|
|
|
| Payroll and welfare payable |
|
|
56,056 |
|
|
|
59,490 |
|
|
|
8,882 |
|
| Amounts due to related parties |
|
|
4,485 |
|
|
|
3,768 |
|
|
|
563 |
|
| Tax payables |
|
|
409,063 |
|
|
|
611,420 |
|
|
|
91,283 |
|
| Accrued expenses and other current liabilities |
|
|
118,808 |
|
|
|
221,258 |
|
|
|
33,030 |
|
| Other payable related to the disposal of Shanghai Caiyin |
|
|
322,028 |
|
|
|
305,321 |
|
|
|
45,583 |
|
| Lease liabilities |
|
|
35,243 |
|
|
|
26,842 |
|
|
|
4,007 |
|
| TOTAL LIABILITIES |
|
|
945,683 |
|
|
|
1,228,099 |
|
|
|
183,348 |
|
| SHAREHOLDERS' EQUITY |
|
|
|
|
|
|
|
|
|
|
|
|
| Class A ordinary shares (US$ 0.000000005 par value; 108,100,000 shares issued as of December 31, 2021 and June 30, 2022; 108,100,000 and 107,198,796 shares outstanding as of December 31, 2021 and June 30, 2022)3 |
|
|
0 |
|
|
|
0 |
|
|
|
0 |
|
| Class B ordinary shares (US$ 0.000000005 par value; 108,000,000 shares issued and outstanding as of December 31, 2021 and June 30, 2022)3 |
|
|
0 |
|
|
|
0 |
|
|
|
0 |
|
| Additional paid-in capital |
|
|
840,580 |
|
|
|
845,856 |
|
|
|
126,283 |
|
| Treasury stock (nil and 901,204 shares as of December 31, 2021 and June 30, 2022, respectively) |
|
|
- |
|
|
|
(3,106 |
) |
|
|
(464 |
) |
| Accumulated deficit |
|
|
(794,762 |
) |
|
|
(396,182 |
) |
|
|
(59,148 |
) |
| Accumulated other comprehensive loss |
|
|
(17,954 |
) |
|
|
(8,792 |
) |
|
|
(1,313 |
) |
| Total Jiayin Group Inc. shareholder's equity |
|
|
27,864 |
|
|
|
437,776 |
|
|
|
65,358 |
|
| Non-controlling interests |
|
|
(2,115 |
) |
|
|
(2,294 |
) |
|
|
(342 |
) |
| TOTAL SHAREHOLDERS' EQUITY |
|
|
25,749 |
|
|
|
435,482 |
|
|
|
65,016 |
|
| TOTAL LIABILITIES AND EQUITY |
|
|
971,432 |
|
|
|
1,663,581 |
|
|
|
248,364 |
|
|
|
|
|
|
|
|
|
|
|
|
|
|
JIAYIN GROUP INC.
UNAUDITED CONDENSED CONSOLIDATED STATEMENTS OF COMPREHENSIVE INCOME
(Amounts in thousands, except for share and per share data)
|
|
For the Three Months Ended
June 30, |
|
|
For the Six Months Ended
June 30, |
|
|
|
2021 |
|
|
2022 |
|
|
2021 |
|
|
2022 |
|
|
|
RMB |
|
|
RMB |
|
|
US$ |
|
|
RMB |
|
|
RMB |
|
|
US$ |
|
| Net revenue (including revenue from related parties of RMB12,069 and RMB1,513 for 2021Q2 and 2022Q2, RMB23,880 and RMB5,253 for 2021H1 and 2022H1, respectively) |
|
|
492,173 |
|
|
|
811,554 |
|
|
|
121,162 |
|
|
|
835,228 |
|
|
|
1,322,728 |
|
|
|
197,478 |
|
| Operating costs and expenses: |
|
|
|
|
|
|
|
|
|
|
|
|
|
|
|
|
|
|
|
|
|
|
|
|
| Origination and servicing |
|
|
(83,224 |
) |
|
|
(128,283 |
) |
|
|
(19,152 |
) |
|
|
(147,323 |
) |
|
|
(221,685 |
) |
|
|
(33,097 |
) |
| Cost of sales |
|
|
(4,983 |
) |
|
|
- |
|
|
|
- |
|
|
|
(4,983 |
) |
|
|
- |
|
|
|
- |
|
| Allowance for receivables and contract assets |
|
|
(13,042 |
) |
|
|
(7,042 |
) |
|
|
(1,051 |
) |
|
|
(21,052 |
) |
|
|
(11,062 |
) |
|
|
(1,652 |
) |
| Sales and marketing |
|
|
(174,220 |
) |
|
|
(235,030 |
) |
|
|
(35,089 |
) |
|
|
(265,465 |
) |
|
|
(383,819 |
) |
|
|
(57,303 |
) |
| General and administrative |
|
|
(35,169 |
) |
|
|
(42,604 |
) |
|
|
(6,361 |
) |
|
|
(72,962 |
) |
|
|
(83,312 |
) |
|
|
(12,438 |
) |
| Research and development |
|
|
(31,924 |
) |
|
|
(54,128 |
) |
|
|
(8,081 |
) |
|
|
(60,045 |
) |
|
|
(95,895 |
) |
|
|
(14,317 |
) |
| Total operating costs and expenses |
|
|
(342,562 |
) |
|
|
(467,087 |
) |
|
|
(69,734 |
) |
|
|
(571,830 |
) |
|
|
(795,773 |
) |
|
|
(118,807 |
) |
| Income from operation |
|
|
149,611 |
|
|
|
344,467 |
|
|
|
51,428 |
|
|
|
263,398 |
|
|
|
526,955 |
|
|
|
78,671 |
|
| Interest income |
|
|
1,018 |
|
|
|
339 |
|
|
|
50 |
|
|
|
113 |
|
|
|
614 |
|
|
|
92 |
|
| Other income (expense) |
|
|
10,426 |
|
|
|
(11,121 |
) |
|
|
(1,660 |
) |
|
|
12,362 |
|
|
|
(6,616 |
) |
|
|
(988 |
) |
| Income before income taxes and income from investment in affiliates |
|
|
161,055 |
|
|
|
333,685 |
|
|
|
49,818 |
|
|
|
275,873 |
|
|
|
520,953 |
|
|
|
77,775 |
|
| Income tax expense |
|
|
(37,222 |
) |
|
|
(82,313 |
) |
|
|
(12,289 |
) |
|
|
(59,391 |
) |
|
|
(127,713 |
) |
|
|
(19,067 |
) |
| Income from investment in affiliates |
|
|
3,002 |
|
|
|
2,447 |
|
|
|
365 |
|
|
|
4,027 |
|
|
|
5,227 |
|
|
|
780 |
|
| Net income |
|
|
126,835 |
|
|
|
253,819 |
|
|
|
37,894 |
|
|
|
220,509 |
|
|
|
398,467 |
|
|
|
59,488 |
|
Less: net income (loss) attributable to noncontrolling
interest shareholders |
|
|
7 |
|
|
|
(67 |
) |
|
|
(10 |
) |
|
|
468 |
|
|
|
(113 |
) |
|
|
(17 |
) |
| Net income attributable to Jiayin Group Inc. |
|
|
126,828 |
|
|
|
253,886 |
|
|
|
37,904 |
|
|
|
220,041 |
|
|
|
398,580 |
|
|
|
59,505 |
|
| Weighted average shares used in calculating net income per share: |
|
|
|
|
|
|
|
|
|
|
|
|
|
|
|
|
|
|
|
|
|
|
|
|
| - Basic and diluted |
|
|
216,100,000 |
|
|
|
216,070,290 |
|
|
|
216,070,290 |
|
|
|
216,100,000 |
|
|
|
216,085,063 |
|
|
|
216,085,063 |
|
| Net income per share: |
|
|
|
|
|
|
|
|
|
|
|
|
|
|
|
|
|
|
|
|
|
|
|
|
| - Basic and diluted |
|
|
0.59 |
|
|
|
1.18 |
|
|
|
0.18 |
|
|
|
1.02 |
|
|
|
1.84 |
|
|
|
0.28 |
|
| Net income |
|
|
126,835 |
|
|
|
253,819 |
|
|
|
37,894 |
|
|
|
220,509 |
|
|
|
398,467 |
|
|
|
59,488 |
|
| Other comprehensive income, net of tax of nil: |
|
|
|
|
|
|
|
|
|
|
|
|
|
|
|
|
|
|
|
|
|
|
|
|
| Foreign currency translation adjustments |
|
|
(2,587 |
) |
|
|
9,955 |
|
|
|
1,486 |
|
|
|
(3,551 |
) |
|
|
9,095 |
|
|
|
1,358 |
|
| Comprehensive income |
|
|
124,248 |
|
|
|
263,774 |
|
|
|
39,380 |
|
|
|
216,958 |
|
|
|
407,562 |
|
|
|
60,846 |
|
| Comprehensive (loss) income attributable to noncontrolling interest |
|
|
(23 |
) |
|
|
(136 |
) |
|
|
(20 |
) |
|
|
341 |
|
|
|
(179 |
) |
|
|
(27 |
) |
| Total comprehensive income attributable to Jiayin Group Inc. |
|
|
124,271 |
|
|
|
263,910 |
|
|
|
39,400 |
|
|
|
216,617 |
|
|
|
407,741 |
|
|
|
60,873 |
|
|
|
|
|
|
|
|
|
|
|
|
|
|
|
|
|
|
|
|
|
|
|
|
|
|
_______________________________
1 “Loan origination volume” refers the loan origination volume facilitated in Mainland China during the period presented.
2 “Repeat borrowing rate” refers to the repeat borrowers as a percentage of all of our borrowers in Mainland China.
“Repeat borrowers” during a certain period refers to borrowers who have borrowed in such period and have borrowed at least twice since such borrowers’ registration on our platform until the end of such period.
3 The total shares authorized for both Class A and Class B are 10,000,000,000,000.
A chart accompanying this announcement is available at https://www.globenewswire.com/NewsRoom/AttachmentNg/31cb07be-0dcc-48b2-a11d-db21e464eaff