What I'm about to say will challenge even the most steadfast gold bears - or anyone for that matter right now who thinks that gold has seen its better days.
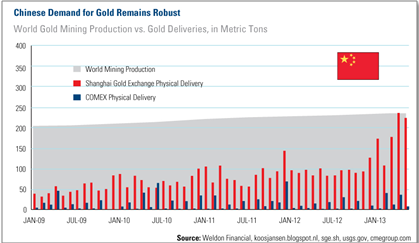
The chart below tells a story - a big story. In fact, I encourage you to forward this email to anyone you know who is serious about his money.
What I found here, with the help of Frank Holmes from U.S. Global and one of the smartest people on earth on the potent combination of Asian markets and commodities, is a chart that shows a truly astounding fact about gold.
Let me walk you through it, and what it could mean to your money, your gold and your financial future.
 Courtesy U.S. Global Advisors -click to enlarge
The grey backdrop is total world mining production. The blue vertical lines represent COMEX gold deliveries. And the big long vertical red lines? That's physical gold delivery on the Shanghai gold exchange.
The takeaway? - Chinese demand for physical delivery all by itself is nearly equal to total worldwide gold production.
That's not a misprint.
In fact, so far this year Chinese deliveries through the Shanghai exchange account for nearly 50% of total global production all by themselves. The COMEX that's part of the New York Mercantile Exchange is almost an afterthought.
This is about as bullish as it gets because the basic laws of supply and demand stipulate that whenever supply is reduced but demand remains constant or accelerates, higher prices result.
No stopping it
This is as immutable as the sun coming up tomorrow or the grass turning green in the spring.
This is good for the markets in general, especially with Bernanke hell bent on keeping the "bad is good theme alive" when it comes to further stimulus.
And this is positively great for gutsy gold investors at a time when others want to relegate it to the scrap pile.
Imagine what happens when people actually figure out that
China is buying so much gold that physical deliveries there could account for 100% of worldwide production by year's end?
The first will be additional opportunities that I expect current volatility to create in the weeks ahead. My
Geiger Index is flickering yellow on a handful of solid gold related opportunities as I type this.
The second are simply related to capturing profits. I expect the pace to pick up as gold becomes an important part of that annual money management right of fall passage - "window dressing" when entire portfolios are rotated in an effort to build in bigger Wall Street bonus checks.
Savvy Investors could be very busy and incredibly profitable a few months from now.
Editor's Note: I hope you're one of these smart gold investors. I know Keith's
Geiger Index subscribers will be.
https://moneymorning.com/2013/07/10/if-you-own-gold-you-must-see-this-chart/#.UeV1zI11_Tp