FRACTAL VIEWS: GOLD
Note: Actionables at the close of this report
This time, pictures do tell the story.
It is getting
gold outside.
Brrrr. And no, you don't need a weatherman to know which way the wind blows.
Charts and graphs maybe. Here are two from our
TCR family,
fractal views of gold's rise.
A
fractal is a pattern that mimics the same pattern on a larger or smaller scale. It's a shrunk version of the original within the original.
One of our chart creators, a Florida investment strategist and active investor, ventures, "In nature this happens all the time. In commodities and investments it reflects human nature over periods of time."
That's
Anthony Giallourakis, whom we have been citing of late.
TCR audience, if you want to know why we are broadcasting fractal views from folks who do
not get paid to speak at shows or read their tea leaves on cable TV, it is because the talking heads for the past five years are consistently, pitifully WRONG. (
I include myself and my dogged belief in metals prospectors and producers among those losers.)
These talking heads, whose names we all know, are sales-folks for their brokerages, or for their asset management businesses, or for their commodities-linked companies, or their TV shows, or their publishing networks.

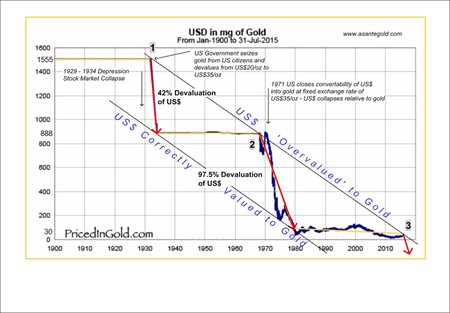
The first illustration -- technically not a fractal but instead an image of the US$ priced in milligrams of gold from 1900 to date -- comes from
Douglas MacQuarrie, whom I met 6 years ago in Ghana at Obotan
. We shared some goat-meat stew.
?
Doug is former CEO of PMI Gold, which developed the
Obotan Gold Project -- now owned by
Asanko Gold and headed to production.
Mr. MacQuarrie now runs
Asante Gold (ASE in Canada), which is developing a project near the old and historic Obuasi Mine in Ghana. Doug is a Canadian and a geologist and not a weatherman.
?He says, "?The striking pattern between the two trend lines is the correction of the U.S. dollar at turning points 1, 2,? and soon to be 3,? I believe, ?relative to the world's only real money, which is gold. These events occur roughly every 40 years."?
?Doug MacQuarrie's chart suggests we are "near" another of these major turning points. If history means anything, the devaluation in most major currencies will be "large" (that is, the buying power of currency in the bank will be destroyed).
The revaluation of gold relative to those currencies likely will be "strongly to the upside," Mr. MacQuarrie says.
I assume (a
dangerous word) that our
TCR subscribers via
TCR/thomcalandra.com and other sources are aware of 1. gold's August rally; 2. China's diminishing currency; and 3. more drumbeats from economists, politicians and talking heads about central banks' tens of trillions of
dollars, euros, yen, yuan, rubles worth of paper cut-ups. (The
paper -- bonds largely -- is used to pacify voters, keep commercial banks in business, start and wage trade wars and keep intact in blowing sands the pile-on pyramid in a desert mirage.)
Doug these days is busy bringing his company's
Kubi project into production; it has about 400,000 ounces of gold in all (Canadian) regulatory categories -- at about 5 grams per metric ton. I like
Asante Gold because Doug and his partners own almost 40 percent of the fewer than 30 million shares. I have yet to purchase ASE.

No. 2 graphic comes from Mr. Giallourakis. He's the yen-franc confirmation theorist. He saw Douglas's graph, and he crafted something l-o-n-g-e-r stretched in time terms.
"I've taken two of the charts from Pricedingold.com and discovered a fractal of the long term chart, within the last 16 years." That's Tony, who like Doug is not a
talking head, thank goodness.
Notice above that the patterns are similar. The black period mark shows where the shorter term period positioned within the longer term.
If the pattern holds as a true 1/3 fractal, "then we should now be in a bull market in gold for the next 5 years, with new all-time highs being hit along the way," says Mr. Giallourakis.
There you have it. I present this material as a service to our
TCRaudience, many of whom appreciate charts and logarithms. My own specialty is people, people connections and early information about investments in commodities and occasionally in biomedical and special situations.
KINGDOM'S GOLD
 This Cambodia feature article
 -- snapshot above -- is not available yet to the
public.
?The article will appear for free in the next several weeks from its publisher, FOCUS ASEAN.
ACTIONABLES: [
TCR SUBSCRIBERS ONLY PLEASE]
?
?
?
?
?
-- Thom Calandra
THE CALANDRA REPORT: Subscribe
Now $139 yearly!
THE CALANDRA REPORT
$139: Will Recur Yearly
Thom Calandra & TCR are researchers and investors. They are not registered investment advisers. The research and material they offer to subscribers are meant as editorial opinion.
See: thomcalandra.com for our expanding TCR family.
Twitter: @thomcalandra
FB: thom.calandra