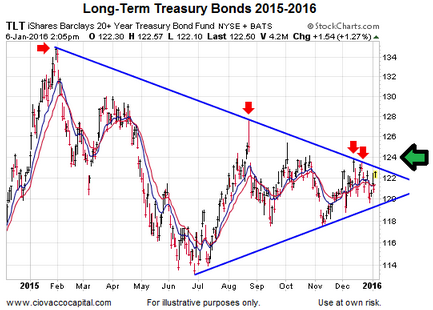
Since maximum fear in the financial markets tends to create demand for safer-haven bonds, the chart of long-term Treasuries (TLT) should be helpful from a risk-assessment perspective. If stocks morph into a bear market in the coming days, weeks, and months, the odds are extremely high TLT will break above the upper blue trendline (toward the green arrow). As of 2:05 pm ET on Wednesday, January 6, TLT remains near a “possible resistance” zone.

We also must respect the possibility of a Fed-induced 1994-like event, marked by a selloff in both stocks and bonds. Bonds are one of many relevant inputs.
This entry was posted on Wednesday, January 6th, 2016 at 2:30 pm and is filed under Stocks - U.S.. You can follow any responses to this entry through the RSS 2.0 feed. Both comments and pings are currently closed.

Entries (RSS)
Atom Feed Copyright © 2014 Ciovacco Capital Management, LLC. All Rights Reserved. Chris Ciovacco is the Chief Investment Officer for Ciovacco Capital Management, LLC (CCM). Terms of Use. This article contains the current opinions of the author but not necessarily those of CCM. The opinions are subject to change without notice. This article is distributed for informational purposes only and should not be considered as investment advice or a recommendation of any particular security, strategy or investment product. The charts and comments are not recommendations to buy or sell any security. Market sectors and related ETFs are selected based on his opinion as to their importance in providing the viewer a comprehensive summary of market conditions for the featured period. Chart annotations are not predictive of any future market action rather they only demonstrate the opinion of the author as to a range of possibilities going forward. All material presented herein is believed to be reliable but we cannot attest to its accuracy. The information contained herein (including historical prices or values) has been obtained from sources that Ciovacco Capital Management (CCM) considers to be reliable; however, CCM makes no representation as to, or accepts any responsibility or liability for, the accuracy or completeness of the information contained herein or any decision made or action taken by you or any third party in reliance upon the data. Some results are derived using historical estimations from available data. Investment recommendations may change and readers are urged to check with tax and investment advisors before making any investment decisions. Opinions expressed in these reports may change without prior notice. This memorandum is based on information available to the public. No representation is made that it is accurate or complete. This memorandum is not an offer to buy or sell or a solicitation of an offer to buy or sell the securities mentioned. The investments discussed in this report may be unsuitable for investors depending on their specific investment objectives and financial position. Past performance is not necessarily a guide to future performance. The price or value of the investments to which this report relates, either directly or indirectly, may fall or rise against the interest of investors. All prices and yields contained in this report are subject to change without notice. This information is based on hypothetical assumptions and is intended for illustrative purposes only. PAST PERFORMANCE DOES NOT GUARANTEE FUTURE RESULTS. CCM would like to thank StockCharts.com for helping Short Takes create great looking charts Short Takes is proudly powered by WordPress . Entries (RSS)