It is no understatement to say that the coming trading week will be an extremely important one, and that it has the potential to set the direction for the remainder of 2016. We have explained throughout January that our indicators evolved towards extreme levels. The indicators in our methodology are based on intermarket dynamics, stock market internals, fundamentals, and sentiment, both on short term and secular time frames.
We identified crude oil as THE most important driver for the sell off in stocks. The intermarket correlation between the two assets has become clear every time crude collapsed in the last 18 months. The first chart makes that point. Readers should focus on the time periods in which crude investors panicked, and their effect on the stock market. The lower pane of the chart shows the rate of change in the price of crude oil. Panic, according to our standards, arises as soon as crude falls more than 10% in two weeks (12 trading days). The blue dotted line shows that threshold.
The key point of this chart is that, each time crude sold off to panic levels, stock investors panicked as well, as indicated with the red rectangles.
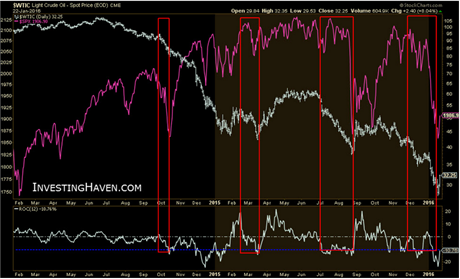
As crude has been putting pressure on stock markets, the question really is at which point crude is going to stop falling. To answer that question, we looked at sentiment indicators as well as price behavior on crude’s secular chart. As explained in last week’s article, both confirmed that a bottom was about to set. Given Wednesday’s selling climax, we believe the bottom is in. So far, our view is confirmed by Sentimentrader’s latest insight: every time crude oil has jumped +10% in two days from a low, it signaled the end of major bear markets (in 3 out of 4 times).
We believe there is sufficient confirmation that a long term bottom in crude oil has been set, which would be extremely friendly for stock markets around the world.
So far, price action in the S&P 500 reminds us of 2011. Back then, the euro was the key driver of panic, today it is crude. Back then, the European and U.S. central banks stimulated markets to get out of the slump, right at a time when stocks were testing their uptrend. Today, we hear the ECB President talking about a new round of stimulus, only to see stock markets bounce sharply higher right at support. We are very curious to see what the message will be of the U.S. Fed later this week, and we anticipate a dovish speech which, together with crude’s bottoming, could push stocks sharply higher. Central banks have confirmed time and over again that they will remain accommodative, certainly when markets were struggling.
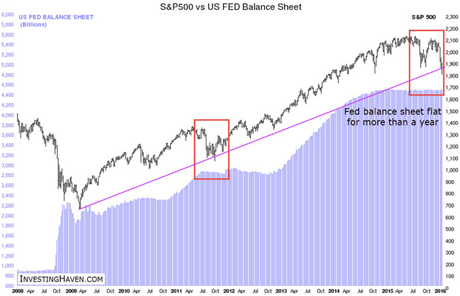
Note how the S&P 500 reacted in 2011 when the market understood that U.S. Fed would ease its QE policy (red rectangle). The reaction since last summer is very similar, as seen on the above chart.
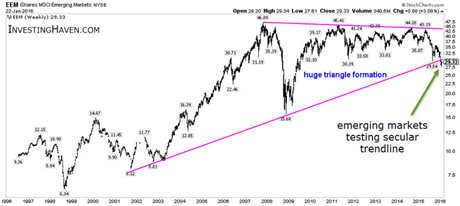
Emerging markets are testing long term support as well. So far, they have broken down, as seen on the next chart. However, we believe the breakdown was the result of crude’s selling climax, leading us to believe there is a high probability of a false breakdown. Bears have the benefit of the doubt until proven otherwise, bulls could reverse the breakdown this week, which is another reason why the coming days are so crucial.
But there are more reasons why this week is setting up to be critical. Copper, the other leading commodity, is testing its secular trend which started in 2002, as illustrated by the next chart. Note how this secular trendline coincides with secular support in crude and stocks, as discussed before. In our own words: leading commodities and stocks confirm how the market has arrived at a critical ‘make or break’ point.
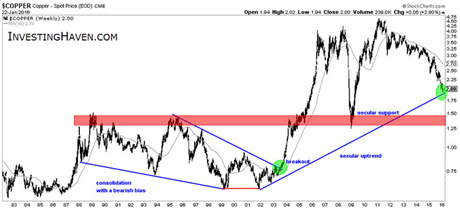
If current support in copper would not hold, then it would be eyeing the $1.25 to $1.50 area for huge support, which is more than 30% below today’s levels
Meantime, the U.S. dollar has clearly broken out from its secular downtrend. We know it is hard to believe, given the explosion of the Fed’s balance sheet, but the greenback’s chart is crystal clear in making that point. It is certainly not what most in the hard asset camp would have expected. We vividly remember how some predicted in 2011 that the bottom would fall out of the dollar, and it would crash to unimaginable levels like 50 and 30. That was, uncoincidentally, at the time gold was peaking. Things turned out differently. We simply let our indicators and charts speak.
Last year, the dollar was putting enormous pressure on commodities, in particular crude oil and copper. Going forward, even with a bull market in the dollar, we anticipate that its destructive effect on most commodities will ease.

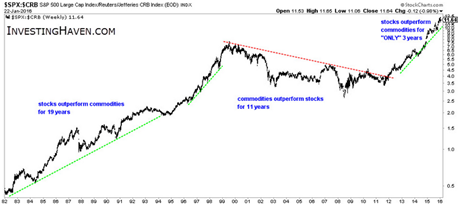
Current trends still favor stocks above commodities. As said, the dollar will ease its pressure on commodities, but that does not mean that commodities are about to reverse their bear market. Best case, they start a period of consolidation, given recent price action. With a strong dollar and technical damage in the commodities complex, we cannot imagine that commodities are about to resume a bull market. The long term stocks to commodities ratio shows a preference for stocks, and makes the point that this trend has a tendency to last many years.
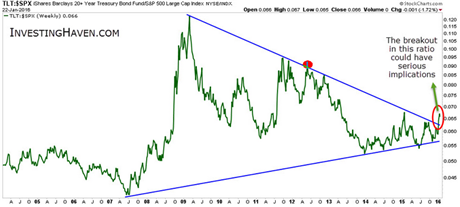
Our closing note is one of cautiousness. Intermarket dynamics are a crucial part of our methodology. That said, the bonds to stocks ratio is clearly signaling a trend reversal. This could mean two things in our view. The most likely interpretation is that a new interest rate cycle has started. If that’s the message of this ratio, then it is important to see how stocks, currencies and commodities behave with the start of this new trend. The bearish interpretation, however, is that this ratio signals a growing flight to safety, which could be a preliminary sign that more pain is coming in all markets.
CONCLUSION:
We believe crude’s sell off is over. Consequently, pressure on stock markets around the globe is about to ease. Also, accommodative central bank talk will be supportive.
The start of this new interest rate cycle correlates with a bull market in the U.S. dollar and stocks, certainly not commodities which are set for a consolidation period (best case). There is a possibility of much more pain in stocks, as potentially signaled by the bonds to stocks ratio, but our belief is that such a probability is low.
We look for confirmations based over the course of next week, and we believe markets will determine the trends for the remainder of 2016.