The silver price and the US Dollar/South African Rand exchange rate (USD/ZAR) have a very interesting relationship that goes back a long way. Due to the nature of this relationship, I have found the USD/ZAR chart to be a good tool for determining a silver bottom.
In Jan 1980, when silver peaked at about $50, the USD/ZAR was trading at around 0.817. Today, the USD/ZAR rate is trading at about 14.366 – about 17.6 times higher than the Jan 1980 rate,
whereas silver is trading at $16.2 – almost three times lower than the Jan 1980 high.
So, in the long run, the two move in opposite directions. When the USD/ZAR rate is moving up, then the silver price is moving down, and vice versa. Furthermore, when the USS/ZAR rate is making a top, then a bottom in silver is normally very close (before or after the USD/ZAR peak).
In a related manner,
the US Dollar Index provides a good signal for when gold rallies are coming.
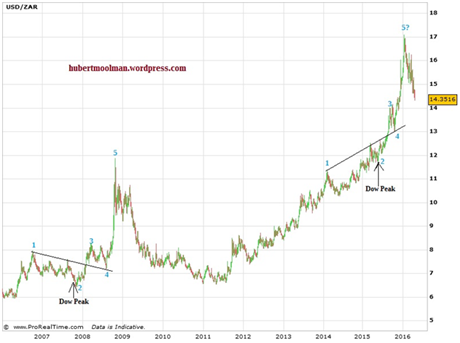
Below is a basic short-term fractal analysis of the USD/ZAR chart (from fxstreet.com):

On the chart I have highlighted two possible fractals (with points 1 to 5). The fractals are very similar (the angle is a bit different), and importantly appear during similar conditions (relative to a Dow peak). The second fractal appears to have reached point 5, which is a short-term top for the USD/ZAR chart, and very likely a long-term peak (since 1980).
If it is indeed a long term peak for the USD/ZAR rate, then one should expect a very important bottom for silver around that date. Silver did make a bottom on 14 December 2015, about a month before the USD/ZAR top. This silver bottom will likely proof to be the ultimate low before the coming multi-year rally.
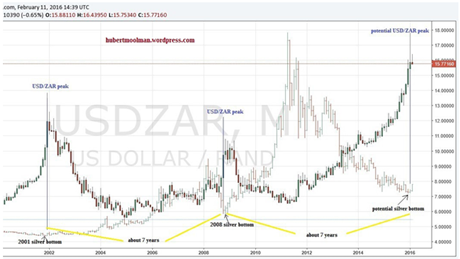
Below, is another comparison (from my 12 Feb 2016 premium update), showing the relationship between USD/ZAR peaks and silver bottoms:

On the chart (from tradingview.com), I have drawn blue lines at the 2001, 2008 and potential Jan 2016 USD/ZAR peaks. One can see how close to these peaks the 2001, 2008 and potential Dec 2015 silver bottoms were.
Given, the look of the Jan 2016 candlestick; it is likely that the USD/ZAR chart has peaked.
If it has indeed peaked, then there is a very strong likelihood that the December 2015 bottom in
silver is actually the bottom since the 2011 peak. It is interesting to note that there is a 7-year
interval between the silver bottoms.
For more on this and this kind of fractal analysis, you are welcome to subscribe to my
premium service. I have also recently completed a
Silver Fractal Analysis Report as well as a
Gold Fractal Analysis Report.
Warm regards,
Hubert