I want to begin with a quote from a recent Cornerstone Macro report that succinctly summarizes the research firm’s view on growth prospects in emerging markets, China specifically. Emphasis is my own:
Our most out-of-consensus call this year is the belief that China, and by extension many emerging markets, will see a cyclical recovery in 2016. We understand the bearish case for emerging markets on a multiyear basis quite well, but we also recognize that in a given year, any stock, sector or region can have a cyclical rebound if the conditions are right. In fact, we’ve already seen leading indicators of economic activity and earnings perk up in 2016 as PMIs have rebounded in many areas of the world. That is all it takes for markets, from equities to CDS, to respond more favorably as overly pessimistic views get rerated. And like in most cyclical recoveries that take place in a regime of structural headwinds, we don’t expect it to last beyond a few quarters.
There’s a lot to unpack here, but I’ll say upfront that Cornerstone’s analysis is directly in line with our own, especially where the purchasing managers’ index (PMI) is concerned. China’s March PMI reading, at 49.7, was not only at its highest since February 2015 but it also crossed above its three-month moving average—
a clear bullish signal, as I explained in-depth in January.
I spend a lot of time talking about the PMI as a forward-looking indicator of commodity prices and economic activity. As money managers, we find it to be far superior to GDP in forecasting market conditions three and six months out. In the past I’ve likened it to the high beams on your car.

We were one of the earliest shops to make the connection between PMIs and future conditions, and we continue to be validated. Just last week, J.P.Morgan admitted in its morning note that “stocks are taking their cues from the monthly PMIs,” the manufacturing surveys in particular, as opposed to GDP.
We eagerly await China’s April PMI reading and are optimistic that this cyclical recovery has legs.
Cornerstone’s outlook is supported by a recent study conducted by CLSA, which found that 73 percent of “Mr. and Mrs. China” expect to be better off three years from now, while only 3 percent expect to be worse off:
Optimism is strongest among those in higher-tier cities, reflecting the disparity in economic vibrancy across tiers: as many as 80 percent of families in first-tier cities have optimistic outlook. The figure is lower, albeit still strong, at 68 percent among families in the third tier.
More than half of those surveyed said they expected to be driving a nicer car and living in a bigger home in the next few years, which is a boon for materials and metals such as platinum and palladium, used in catalytic converters.
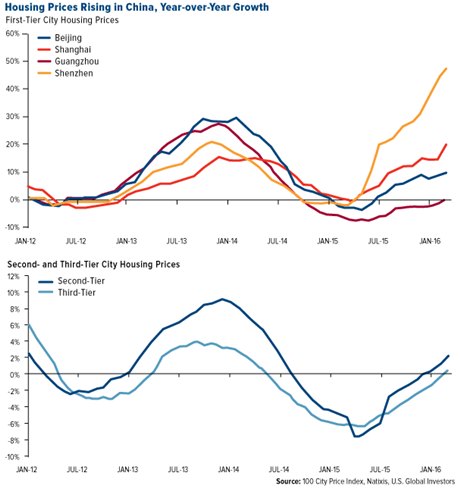
As a reflection of growing demand for new homes, house prices in China are climbing right now in first-tier and, to a lesser extent, lower-tier cities, a sign that more and more citizens are seeking the “Chinese dream.”
 China’s Insatiable Appetite for Metals
China’s appetite for metals—gold, silver, copper, iron ore and more—is growing, another sign that the Asian giant is in turnaround mode.
China is the world’s largest importer, consumer and producer of gold. Last year, physical delivery from the Shanghai Gold Exchange (SGE) reached
a record number of tonnes, more than 90 percent of total global output for 2015. Meanwhile, the People’s Bank of China continues to add to its reserves nearly every month and is now the sixth largest holder of gold—the fifth largest if we don’t include the International Monetary Fund (IMF). As of this month, the bank holds
1,788 tonnes (63 million ounces) of the yellow metal, which amounts to only 2.2 percent of its total foreign reserves, according to calculations by the World Gold Council.
Now, in a move that’s sure to boost China’s financial clout in global financial markets even more, the country just introduced a new fix price for gold, one that is denominated in Chinese renminbi (also known as the yuan).
Gold is currently priced in U.S. dollars. That’s been the case for a century. But since gold demand has been shifting from West to East, China has desired a larger role in pricing the metal. The Shanghai fix price is designed with that goal in mind.
It’s unlikely that Shanghai will usurp New York and London prices any time soon, but over time it will allow China to exert greater control over the price of the commodity it consumes in vaster quantities than any other country.
China’s gold consumption isn’t the only thing turning heads. I shared with you last week that the country imported
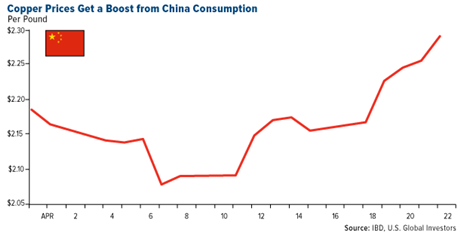
39 percent more copper in March than in the same month last year. (Shipments also rose 18.7 percent in renminbi terms in March year-over-year.)
The heightened copper demand has fueled renewed optimisim in the red metal. Prices are up 6 percent month-to-date.
Caixin reports that China’s
iron ore imports are surging on lower prices. In the first two months of 2016, the country purchased 86 percent more iron than it needs. What’s more, total imports were up 84 percent from the same time last year.
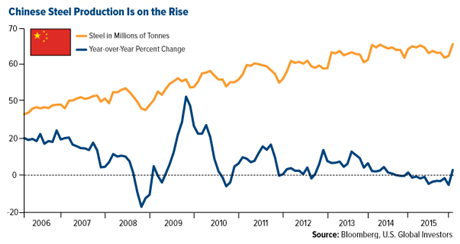
Steel production, which requires iron ore, is likewise ramping up. Output is currently at 70.65 million tonnes, an increase of nearly 3 percent year-over-year.
For reasons unknown, China has also been growing its silver inventories pretty substantially for the past six months, according to an article
shared on Zero Hedge. This month, as of April 19, the Shanghai Futures Exchange added a massive 1,706 tonnes, which is a 452 percent increase from the amount it added in April 2015. Shanghai silver inventories are now at thier highest level ever.
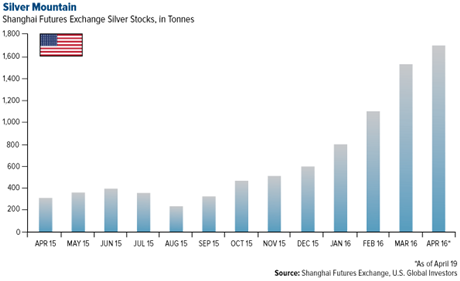
Though unconfirmed, it’s possible this silver will eventually be used in the production of solar panels, every one of which
uses between 15 and 20 grams of the white metal. China is already the world’s largest market for solar energy—it surpassed Germany at the end of last year—with 43.2 gigawatts (GW) of capacity. (By comparison, the U.S. currently has 27.8 GW.) But get this: It plans on adding
an additional 143 GW by 2020, which will require a biblical amount of silver.
Not to be outdone, India also plans significant expansion to its solar capacity, with a goal of
100 GW by 2022, according to the Indian government.
Metals Still Have Room to Rock
We know that money supply growth can lead to a rise in commodity prices. Note that Chinese money supply peaked in 2010 and has since fallen, along with commodity prices.
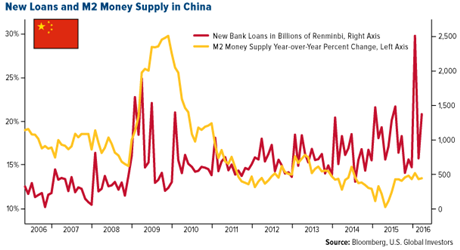
New bank loans in China have spiked dramatically this year while money supply has grown more than 13 percent year-over-year, which is good for metals and manufacturing.
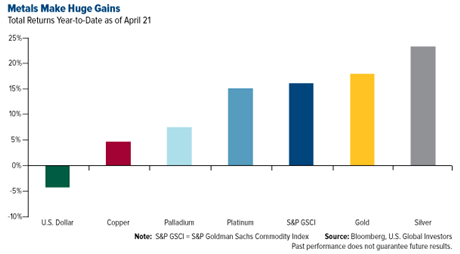
The increase in metals demand, not to mention the weakening of the U.S. dollar, has allowed silver to become the top performing commodity of 2016 after overtaking gold.
Despite the rally, gold doesn’t appear to be overbought at this point, based on an oscillator of the last 10 years. We use the 20-day oscillator to gauge an asset’s short-term sentiment. When the reading crosses above two standard deviations, it’s usually considered time to sell. Conversely, when it crosses below negative two standard deviations, it might be a good idea to buy.
Silver is currently sitting at 1.2 standard deviations, suggesting a minor correction at this point would be normal.
 Time to Take Profits in Oil?
The same could be said about Brent oil, which has returned 61 percent since hitting a recent low of $27.88 per barrel in January. This has driven up the Russian ruble and energy stocks. (We’ve recently shown the
correlation between world currenices and commodities.)
The rally has been so strong over the past three months that it’s signaling an opportunity to take profits or wait for a correction. Based on the 20-day oscillator, Brent’s up 1.3 standard deviations, which suggests a correction over the next three months.

Oil has historically bottomed in January/February. The rally this year has not disappointed. Further, it has helped many domestic banks that have been big lenders to the energy sector. High(er) oil prices translate into stronger cash flows for loans.
U.S. Global Investors, Inc. is an investment adviser registered with the Securities and Exchange Commission ("SEC"). This does not mean that we are sponsored, recommended, or approved by the SEC, or that our abilities or qualifications in any respect have been passed upon by the SEC or any officer of the SEC.
This commentary should not be considered a solicitation or offering of any investment product.
Certain materials in this commentary may contain dated information. The information provided was current at the time of publication.
All opinions expressed and data provided are subject to change without notice. Some of these opinions may not be appropriate to every investor. By clicking the link(s) above, you will be directed to a third-party website(s). U.S. Global Investors does not endorse all information supplied by this/these website(s) and is not responsible for its/their content.
The S&P GSCI Total Return Index in USD is widely recognized as the leading measure of general commodity price movements and inflation in the world economy. Index is calculated primarily on a world production weighted basis, comprised of the principal physical commodities futures contracts.
Standard deviation is a measure of the dispersion of a set of data from its mean. The more spread apart the data, the higher the deviation. Standard deviation is also known as historical volatility.
Gross domestic product (GDP) is the monetary value of all the finished goods and services produced within a country's borders in a specific time period, though GDP is usually calculated on an annual basis. It includes all of private and public consumption, government outlays, investments and exports less imports that occur within a defined territory. The Purchasing Manager’s Index is an indicator of the economic health of the manufacturing sector. The PMI index is based on five major indicators: new orders, inventory levels, production, supplier deliveries and the employment environment.
M2 Money Supply is a broad measure of money supply that includes M1 in addition to all time-related deposits, savings deposits, and non-institutional money-market funds.
The 100 Cities Index tracks pricing data for 100 Tier 1, Tier 2, and Tier 3 cities in China.