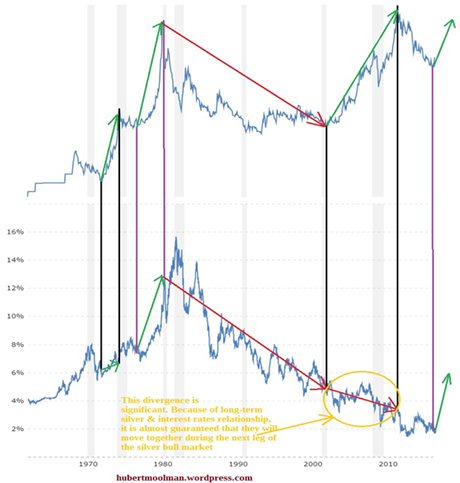
During the previous silver bull market, interest rates and silver moved in the same direction (up). This makes sense, given the fact that silver and interest rates move together in the long run – for the
last 100 years at least.
The current silver bull market (since 2001) has seen a big divergence between silver prices and interest rates. Below, is a comparison of interest rates and silver prices since 1962:

On the charts, I have shown how interest rates and silver prices have moved together during the first phase of the 70s silver bull market (1971 to 1974), as well as the second phase (1976 to 1980).
I have also marked the big divergence that occurred from 2001 to 2011 (the first phase of the silver bull market). This is the biggest period of divergence over the last 100 years. Since silver and interest rate are positively correlated in the long run, it is almost guaranteed that they will move together (up) during the next phase of the silver bull market.
A spike in interest rates (meaning – a collapse of bonds) will provide an explosive boost to the coming silver rally.
Previously, I have shown how the structure of the 70s silver bull market is similar to the current one. This similarity is also true for interest rates. Again, this makes sense, given the fact that silver and interest rates move together in the long run.
Below, I have done fractal analysis of the 10-year US Treasury Yield, to show that similarity:

On the chart, I have marked similar points (1 to 4) to show how the 70s period is like the current one. If the comparison is valid, then the yield has bottomed (or is close to a bottom), and will eventually break out of the downtrend that has been in place for decades.
This move will most likely collapse the bond markets. A silver price move pass $50 would likely confirm this.
For more on this and this kind of fractal analysis, you are welcome to subscribe to my
premium service. I have also recently completed a
Silver Fractal Analysis Report as well as a
Gold Fractal Analysis Report.
Warm regards,
Hubert