Our pace for posting commentaries will slow down for August by design over the next few weeks, and for the last week of August, there will be no posting due to vacation time. This week, focus will be solely on the charts. There is so much going on in the world and with the Bread and Circuses election in the United States, the sum of which is enough to send the price of precious metals considerably higher, but the reality is price is still under the control of Chinese buying at bargain prices while the West’s central bankers try to keep alive the Ponzi scheme facade regarding gold and silver.
The globalists behind the fiat curtain have been exposed for their financial and political chicanery to keep the vastly underwater banking system “alive and well,” yet the public has no unified voice to be so shocked by the extreme theft by the bankers and their political hacks, so the game plays on.
Gold and silver reflect the only reality that exists in this sea of deceit, the U S strong-arming the vassal political union called the EU with no backbone or popular support, the ongoing disruption and war in the Middle East, the US using NATO to saber-rattle against Russia, forever provoking Putin and casting blame on Russia for much of the ills that go on
around the world when only US fingerprints are to be found everywhere.
There are many articles that discuss the almost inevitability of WWIII with the US not only provoking Russia but China, as well. When the financial house of cards can no longer be held, the go-to alternative has always been war to get the public minds off the source of all woes, the elite’s moneychangers and their ongoing theft from the people.
More thought needs to be given to what practical role gold and silver would play once the fiat Federal Reserve “dollar” loses its status as a reserve currency and receives the recognition it deserves, a third-world nation with a worthless paper fiat currency. How will precious metals holders benefit, and to what use will their holdings be placed?
How may PMs holders are there in Venezuela, and how are they faring? We will look for some answers in future articles. In the meantime, despite the ongoing calls for gold and silver to take off, imminently, the charts do not support a runaway market to the upside.
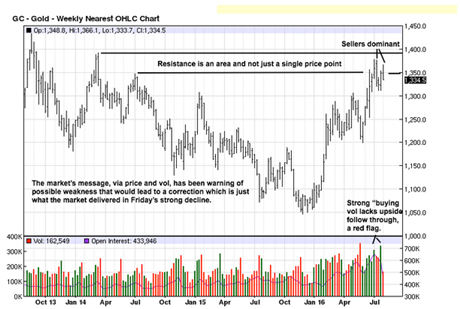
Straight lines are frequently drawn to represent support or resistance when, in fact, both are the function of an area as opposed to a fixed price point. The two horizontal lines on the weekly gold chart originated from prior failed swing highs. Price broke above the lower one but fell just short of the upper resistance line. Yet, price was contained within that area.
The purpose is to take note of where price has failed previously, and then watch the development of how price reacts on a subsequent retest. It is the basis for simply being prepared to respond at support/resistance areas. For example, one can make a huge mistake buying new positions at an area of resistance because a reaction is more probable than upside continuation.
The wide range, poor close bar of 4 weeks ago was a red flag event. It was a message from the market that sellers overwhelmed buyers and pushed price down with buyers unable to sustain the rally, and the selling reaction occurred at a resistance area, answering the how question of the character of price development. Last week was a retest of 4 weeks ago, and we then mentioned how volume was peaking at the high of the rally, another red flag.

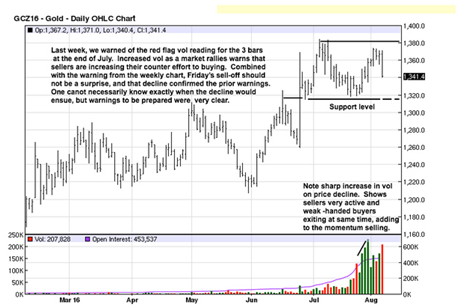
A more detailed picture emerges on the daily chart. The early July high was an overlapping of 4 TDs, a sign of a battle between the opposing forces of buyers v sellers. After the 4th day, price broke lower making those 4 overlapping bars an area of resistance to be watched on any retest. The retest came last week.
We made note of how the volume increased as price rallied, and that is a red flag due to sellers increasing their activity to challenge buyers. Price stalled in the beginning of trade for August. We had recommended long positions, previously, and opted to exit at the end of July based on the read we just provided. Price did continue higher from our exit, but after Friday, price is now much lower than the exit. The timing was not pluperfect, but it was effective.
Friday’s high volume accompanied the selling, and that suggests either a retest of the lower end of the TR, or several more TDs before buyers can regain control. Now a read of the opposite is required, how price reacts on the decline to indicate a change in sentiment from sellers back to buyers. Our read says there is no hurry to get long in the paper market.

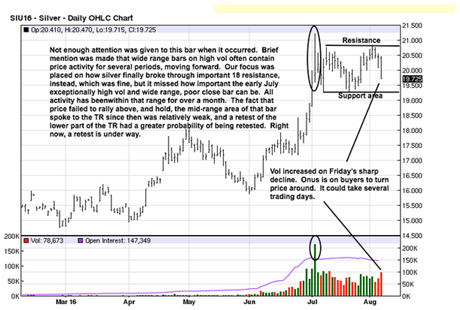
Silver also had a weekly range of resistance but unlike gold, silver was unable to even penetrate the lower horizontal resistance line, and that said silver was relatively weaker than gold structurally in the charts.

The early price activity warning in early July did not occur in gold as it did in silver. We did not give that bar enough attention because it become controlling for how silver developed in the next month + of trading. The failed swing high, 3 TDs later, did function as an almost precise failed high from last week, and Friday’s lack of upside follow through after Thursday morning’s strong volume rally was the market message that price was sure to correct.
As with gold, there is no hurry to be long in the paper market while the tenor of the current correction becomes more defined.
The ongoing acquisition of physical gold and silver remains as a priority. For sure, there are no cogent reasons for selling anything previously acquired. Buy and hold is the anthem for PM stackers, and that will not change likely for the next several years.
