Big Moves Often Follow
Regular viewers of CCM’s weekly videos may be familiar with the expression “the longer a market goes sideways, the bigger the move you tend to get after a breakout or breakdown”, which aligns with the concept of periods of low volatility often being followed by big moves in asset prices.
Lowest Level Dating Back To 1982
Bollinger band width is one way to track relative volatility. When Bollinger band width readings hit extremely low levels, it tells us to be open to a big move. The S&P 500’s daily Bollinger Band width has never been lower than it is today, using data back to 1982, which means a big move could be coming soon in stocks.

The concepts behind Bollinger band width as described by StockCharts.com:
Bollinger BandWidth is best known for identifying The Squeeze. This occurs when volatility falls to a very low level, as evidenced by the narrowing bands. The upper and lower bands are based on the standard deviation, which is a measure of volatility. The bands narrow as price flattens or moves within a relatively narrow range. The theory is that periods of low volatility are followed by periods of high volatility. Relatively narrow BandWidth (a.k.a. the Squeeze) can foreshadow a significant advance or decline. After a Squeeze, a price surge and subsequent band break signal the start of a new move. A new advance starts with a Squeeze and subsequent break above the upper band. A new decline starts with a Squeeze and subsequent break below the lower band.
Similar Band Width In 1995
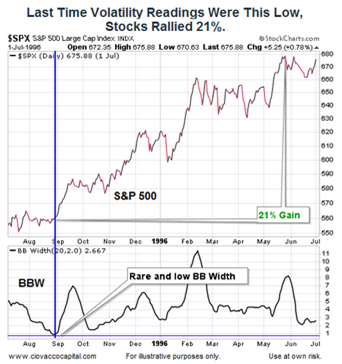
The last time Bollinger band width was as low as it is today was 1995. When volatility returned, the S&P 500 climbed 21%.

What To Look For In 2016
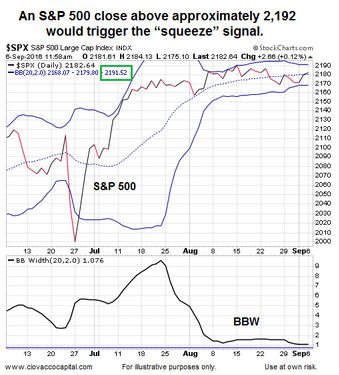
Since there is no perfect signal in the markets, this signal or setup helps us with probabilities, not certainties. To complete the “squeeze” the S&P 500 has to close above the upper Bollinger band shown below. The band level changes over time; as of Tuesday, September 6, the level to watch is 2,192.

Other Rare Signals That Lean Toward Bullish Outcomes
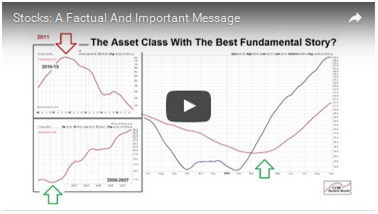
A low Bollinger band width in isolation does not hint at which way the market may break (up or down); that comes with the “squeeze”, which has not occurred yet in 2016. However, the video below covers other bullish signals that have occurred in numerous markets in 2016.
After you click play, use the button in the lower-right corner of the video player to view in
full-screen mode. Hit Esc to exit full-screen mode.

The posts below provide additional evidence telling us to be open to a break to the upside in stocks.
- Is This Long-Term Volume Signal A Warning Flare For Stocks?
- Rare Signal: How Have Stocks Performed In The Past?
- 5 Facts Tell Us To Be Open To More Upside In Stocks
This entry was posted on Tuesday, September 6th, 2016 at 12:53 pm and is filed under Stocks - U.S.. You can follow any responses to this entry through the RSS 2.0 feed. Both comments and pings are currently closed.
Copyright © 2016 Ciovacco Capital Management, LLC. All Rights Reserved. Chris Ciovacco is the Chief Investment Officer for Ciovacco Capital Management, LLC (CCM). Terms of Use. This article contains the current opinions of the author but not necessarily those of CCM. The opinions are subject to change without notice. This article is distributed for informational purposes only and should not be considered as investment advice or a recommendation of any particular security, strategy or investment product. The charts and comments are not recommendations to buy or sell any security. Market sectors and related ETFs are selected based on his opinion as to their importance in providing the viewer a comprehensive summary of market conditions for the featured period. Chart annotations are not predictive of any future market action rather they only demonstrate the opinion of the author as to a range of possibilities going forward. All material presented herein is believed to be reliable but we cannot attest to its accuracy. The information contained herein (including historical prices or values) has been obtained from sources that Ciovacco Capital Management (CCM) considers to be reliable; however, CCM makes no representation as to, or accepts any responsibility or liability for, the accuracy or completeness of the information contained herein or any decision made or action taken by you or any third party in reliance upon the data. Some results are derived using historical estimations from available data. Investment recommendations may change and readers are urged to check with tax and investment advisors before making any investment decisions. Opinions expressed in these reports may change without prior notice. This memorandum is based on information available to the public. No representation is made that it is accurate or complete. This memorandum is not an offer to buy or sell or a solicitation of an offer to buy or sell the securities mentioned. The investments discussed in this report may be unsuitable for investors depending on their specific investment objectives and financial position. Past performance is not necessarily a guide to future performance. The price or value of the investments to which this report relates, either directly or indirectly, may fall or rise against the interest of investors. All prices and yields contained in this report are subject to change without notice. This information is based on hypothetical assumptions and is intended for illustrative purposes only. PAST PERFORMANCE DOES NOT GUARANTEE FUTURE RESULTS. CCM would like to thank StockCharts.com for helping Short Takes create great looking charts Short Takes is proudly powered by WordPress . Entries (RSS)