Stocks and Bonds Both Elevated By Low Rates
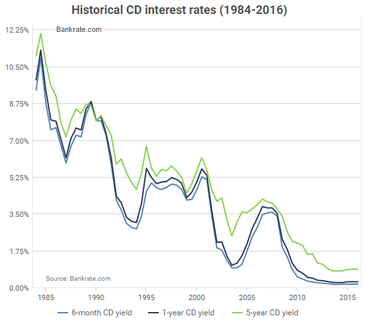
Assume you worked hard your entire life and amassed a nice nest egg, allowing you to retire if you could earn an average of 5.00% annually. That plan would not have required you to take a lot of risk when CD rates were above 5.00% in the 1980s and 1990s (see below).

Search For Higher Returns
However, when CD rates started to fall well below 5.00%, you would have been forced to either lower your income expectations or add higher-yielding investments to your retirement portfolio. The search for yield has created additional demand for riskier assets, including stocks.
Higher Rates Reduce Demand For Stocks
For illustrative purposes, if we assume the Fed raised rates back to 5.00% this month, it is easy to understand how many investors would no longer feel the need to invest a portion of their portfolios in higher-volatility assets, such as stocks. Higher rates reduce demand for riskier assets, which in turn can lead to a decline in stock prices. If we knew stocks and CDs would both produce an annual return of 5.00% over the next decade, most would prefer to own the lower volatility asset (CDs).
Bonds Have Benefited As Well
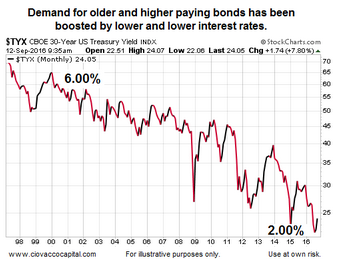
If you invested in a 30-year bond paying over 6.00% in 1999, you would be quite happy with that portion of your portfolio. Fast forward to 2016 when long-term bonds are paying closer to 2.00%. Basic supply and demand tells us most people would rather have a bond paying 6.00% per year than one paying 2.00% per year, which is why bond prices tend to benefit from lower rates. When rates begin to rise, the relative attractiveness of higher paying bonds begins to drop, which is why bond prices tend to fall when the Fed starts to raise rates. The relationship between interest rates and bond prices is based on supply and demand.

Lowering Rates And The Wealth Effect
The wealth effect refers to potential economic benefits created by rising asset prices. When your 401(k) is rising, you feel better about your financial standing. Consumers who feel good about the future tend to spend more, which can be beneficial to the economy. The Fed hopes to stimulate the economy via the wealth effect when they lower interest rates.
Stocks And Bonds Vulnerable To Higher Rates
Rising interest rates can hurt stocks by reducing the demand for riskier assets relative to safer assets. Higher rates can also negatively impact bond prices by reducing the relative attractiveness of higher-yielding bonds that were issued when interest rates were higher. Therefore, stocks and bonds could both sell off if the Fed continues to raise interest rates.
The Wealth Effect Shifts Into Reverse
If higher interest rates put pressure on both stock and bond prices, it stands to reason higher rates can also flip the wealth effect into reverse. When your 401(k) drops, you may not feel as confident to spend and consume as you did when the balance was rising.
Higher Rates Could Spark A Deflationary Spiral In Asset Prices

Last Friday’s plunge in both stocks and bonds provided the Fed with a little reminder of what followed their December 2015 rate hike. The Fed is concerned rate hikes could kick off a difficult to contain deflationary spiral. If asset prices fall, fear increases, causing more investors to hit the sell button…which causes asset prices to fall further and fear to increase…rinse and repeat.
Investors Know Fed Has Juiced Stocks And Bonds
Since central banks have been injecting themselves into the economy and markets with much greater frequency in recent years, investors are well aware of the risks posed by higher interest rates. This knowledge has created a marketplace that has become increasingly skeptical of the Fed’s constant chatter about additional rate hikes. For example, even after numerous Fed speakers talked tough last week on rates, market odds for a September rate hike were still sitting around 24%, meaning the market was saying there was roughly a 76% probability the Fed does not raise rates in September.
How High Are The Risks Of A Bear Market?
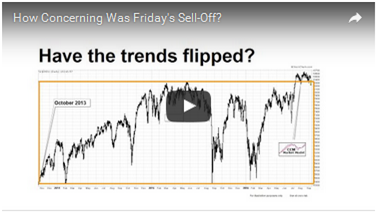
In a bear market, stocks tend to make a series of lower highs and lower lows. In a bull market, stocks tend to make a series of higher highs and higher lows. Note in both cases, the stock market pulls back when it makes a low. Therefore, our concerns increase when the odds of a new bear market are escalating. To make sure we are comparing longer-term apples to longer-term apples, this week’s video covers updated charts from longer-term outlooks outlined on August 20 and September 2. The video also reviews historical cases when volatility followed a bullish breakout from a long-term consolidation box, similar to what recently occurred in all three major U.S. stock indexes. Reviewing facts regarding longer-term bullish probabilities relative to longer-term bearish probabilities allows us to assess the odds of an ongoing bull market relative to the odds of a new bear market.
After you click play, use the button in the lower-right corner of the video player to view in
full-screen mode. Hit Esc to exit full-screen mode.

Low Rates And Excessive Debt
When companies and governments can borrow money for next to nothing, it creates additional incentive to issue more debt. As noted above, rising rates can put pressure on debt instruments. The relationship between global debt, the Fed, and interest rates was outlined in detail in Debt’s Impact On Central Banks, Stocks, Bonds, And Gold.
This entry was posted on Monday, September 12th, 2016 at 10:52 am and is filed under Stocks - U.S.. You can follow any responses to this entry through the RSS 2.0 feed. Both comments and pings are currently closed.
Copyright © 2016 Ciovacco Capital Management, LLC. All Rights Reserved. Chris Ciovacco is the Chief Investment Officer for Ciovacco Capital Management, LLC (CCM). Terms of Use. This article contains the current opinions of the author but not necessarily those of CCM. The opinions are subject to change without notice. This article is distributed for informational purposes only and should not be considered as investment advice or a recommendation of any particular security, strategy or investment product. The charts and comments are not recommendations to buy or sell any security. Market sectors and related ETFs are selected based on his opinion as to their importance in providing the viewer a comprehensive summary of market conditions for the featured period. Chart annotations are not predictive of any future market action rather they only demonstrate the opinion of the author as to a range of possibilities going forward. All material presented herein is believed to be reliable but we cannot attest to its accuracy. The information contained herein (including historical prices or values) has been obtained from sources that Ciovacco Capital Management (CCM) considers to be reliable; however, CCM makes no representation as to, or accepts any responsibility or liability for, the accuracy or completeness of the information contained herein or any decision made or action taken by you or any third party in reliance upon the data. Some results are derived using historical estimations from available data. Investment recommendations may change and readers are urged to check with tax and investment advisors before making any investment decisions. Opinions expressed in these reports may change without prior notice. This memorandum is based on information available to the public. No representation is made that it is accurate or complete. This memorandum is not an offer to buy or sell or a solicitation of an offer to buy or sell the securities mentioned. The investments discussed in this report may be unsuitable for investors depending on their specific investment objectives and financial position. Past performance is not necessarily a guide to future performance. The price or value of the investments to which this report relates, either directly or indirectly, may fall or rise against the interest of investors. All prices and yields contained in this report are subject to change without notice. This information is based on hypothetical assumptions and is intended for illustrative purposes only. PAST PERFORMANCE DOES NOT GUARANTEE FUTURE RESULTS. CCM would like to thank StockCharts.com for helping Short Takes create great looking charts Short Takes is proudly powered by WordPress . Entries (RSS)
