- The VIX Fear Index is arguably the most over-analyzed tool on Wall Street regarding its real-world predictive powers relative to the long-term path of the stock market.
- The common argument is when the VIX spikes, it is indicative of rising fear, and thus stocks typically drop when the VIX rises.
- The VIX measures “expected near-term volatility”, which is quite a bit different than fear or long-term economic concerns
- Can stocks go up when the VIX rises significantly from low levels? You can decide for yourself after reviewing a historical example.
Sounding The Low VIX Sirens For Stocks

If you follow the markets regularly, you have probably run across similar passages to the one shown below from a May 28, 2014 MarketWatch article:
As the VIX continues to sink closer to its historic low of 9.39, many commentators are now discussing the VIX as a “complacency index.” As the VIX falls, it signals increasing levels of investor complacency. Because economist Hyman Minsky taught us that periods of high volatility follow periods of low volatility, many investors are beginning to worry that a “Minsky moment” could be lurking around the next corner that would send volatility higher, increase the risk premium for holding stocks and cause prices to sink.
We agree with portions of the quote above, with two exceptions: (1) when the VIX rises from low levels to higher levels, it does not necessarily mean the stocks are in big trouble, especially when viewed from a longer-term perspective, and (2) low VIX readings do not necessarily align with caution-oriented “complacency”.
Retail Sales Align Nicely With The VIX Story

Having worked on Wall Street for over 20 years, we can confidently state evidence is always available that logically aligns with the bearish narrative for risk-related assets; the same can be said for a bullish narrative. The bearish case got a nice dose of weak data on Thursday, September 15. From Bloomberg:
Sales at U.S. retailers dropped more than forecast in August, indicating a pause in recent consumer-spending strength that has carried the economy.
Purchases declined 0.3 percent from July, the first drop in five months, after a revised 0.1 percent advance in the previous month, Commerce Department figures showed Thursday in Washington. The median projection of economists surveyed by Bloomberg called for a 0.1 percent decline. Excluding cars, sales unexpectedly fell 0.1 percent.
Low VIX Means Trouble For Stocks, Right?
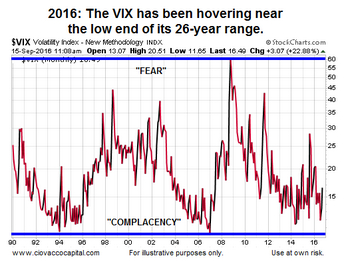
As recently as September 8, 2016, the VIX was hovering near the low end of its long-term range dating back to the 1990s. If that means historic complacency, then logic would tell us that when the VIX rises from very low levels, it must mean rising fear and bad times ahead for stocks…right? That logic often holds in the markets, meaning the VIX can be and is a useful tool for stock investors. However, the strength of a stock market indicator lies in its consistency.
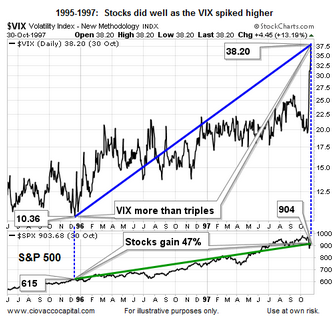
Can stocks rise as the VIX rises from low levels? History not only says “yes”, but it does so emphatically. The chart below shows a period beginning in late 1995 when the VIX started to rise from low levels. The VIX surged from 10.36 in 1995 all the way to 38.20 in late 1997, which is a major spike in the VIX. How did stocks perform over the same period? The S&P 500 gained 47%…yes, that is not a typo…stocks gained 47% during a period when the VIX more than tripled.

For those scoring at home, the 47% move in stocks began when the VIX showed “a high level of investor complacency” with a reading of 10.36. What was the recent 2016 low in the VIX? 11.02.
The VIX Is About Volatility, Not Fear
The moral of the story is there is nothing wrong with having the VIX in your stock market toolkit. However, the VIX needs to be used in the proper context to be more helpful to longer-term stock investors. From a 2014 Yahoo Finance article about the VIX:
Today the VIX sits below 11.50 and stocks are slightly higher despite weak earnings and a widely expected, but still ugly, negative print in first quarter GDP. Rather than interpreting the market action as complacency traders are generally just accepting that the VIX is lower because the market is open for business. The thing is, the VIX never measured “fear.” It measures expected volatility. If 11.5 seems like a low print that’s only because you aren’t putting it in the context of single-digit trailing volatility. The VIX is low for a reason and that reason is that stocks simply aren’t going down in large enough gaps to justify paying much for insurance.
VIX Even Less Relevant On Longer Timeframes
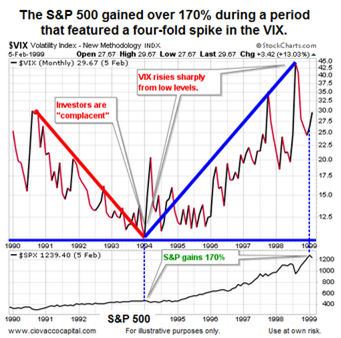
If we take the historical example above out even further in time, it emphasizes the two main points: (1) when the VIX rises from low levels to higher levels, it does not necessarily mean stocks are in big trouble, especially when viewed from a longer-term perspective, and (2) low VIX readings do not necessarily align with caution-oriented “complacency”. If the S&P 500 can gain over 170% during a period in which the VIX rose significantly from historically low levels, it tells us to be careful about how we interpret and use the VIX.

September Rate Hike Odds Drop

The market’s pricing mechanism has an almost infinite number of moving parts. One of the important parts is Fed policy. Thursday’s weaker than expected read on the economy makes it easier for the Fed to stay in the “do nothing” camp in September. From Reuters:
U.S. retail sales fell more than expected in August, pointing to cooling domestic demand that further diminishes expectations of a Federal Reserve interest rate increase next week…Financial markets are pricing in only a 12 percent probability of a rate hike next week, down from 15 percent before the data, according to the CME.
Investment Implications – No Need To Anticipate
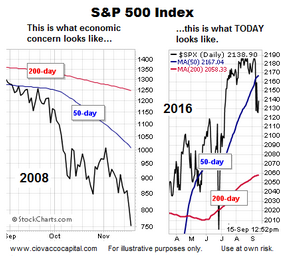
Have stocks corrected after the VIX hit low levels? Yes, we can find numerous historical cases where a rising VIX occurred during a weak period for equities. Regardless of what the VIX does, we know it is highly unlikely the stock market will enter a multiple-month correction or a multiple-year bear market without seeing some evidence of deterioration on the chart of the S&P 500. How vulnerable does the broader stock market look right now? The charts below allow us to compare 2016 to a higher risk period in 2007.

This video clip explains why the charts above are helpful. Is using moving averages a perfect way to manage portfolio risk? No, but used in conjunction with other economic and technical inputs, it can help us stayed aligned with the market’s risk-reward profile.
The VIX Can Be Helpful
Before you begin composing emails or tweets about the usefulness of the VIX, our market model uses the VIX, which means we agree it can be helpful. The key point is time frames. Shorter-term traders may have found countless relevant ways to effectively use the VIX. We are investors, meaning it is important for us to understand what the VIX can and cannot do on a longer-term time horizon relative to the stock market.
This entry was posted on Thursday, September 15th, 2016 at 12:48 pm and is filed under Stocks - U.S.. You can follow any responses to this entry through the RSS 2.0 feed. Both comments and pings are currently closed.
Copyright © 2016 Ciovacco Capital Management, LLC. All Rights Reserved. Chris Ciovacco is the Chief Investment Officer for Ciovacco Capital Management, LLC (CCM). Terms of Use. This article contains the current opinions of the author but not necessarily those of CCM. The opinions are subject to change without notice. This article is distributed for informational purposes only and should not be considered as investment advice or a recommendation of any particular security, strategy or investment product. The charts and comments are not recommendations to buy or sell any security. Market sectors and related ETFs are selected based on his opinion as to their importance in providing the viewer a comprehensive summary of market conditions for the featured period. Chart annotations are not predictive of any future market action rather they only demonstrate the opinion of the author as to a range of possibilities going forward. All material presented herein is believed to be reliable but we cannot attest to its accuracy. The information contained herein (including historical prices or values) has been obtained from sources that Ciovacco Capital Management (CCM) considers to be reliable; however, CCM makes no representation as to, or accepts any responsibility or liability for, the accuracy or completeness of the information contained herein or any decision made or action taken by you or any third party in reliance upon the data. Some results are derived using historical estimations from available data. Investment recommendations may change and readers are urged to check with tax and investment advisors before making any investment decisions. Opinions expressed in these reports may change without prior notice. This memorandum is based on information available to the public. No representation is made that it is accurate or complete. This memorandum is not an offer to buy or sell or a solicitation of an offer to buy or sell the securities mentioned. The investments discussed in this report may be unsuitable for investors depending on their specific investment objectives and financial position. Past performance is not necessarily a guide to future performance. The price or value of the investments to which this report relates, either directly or indirectly, may fall or rise against the interest of investors. All prices and yields contained in this report are subject to change without notice. This information is based on hypothetical assumptions and is intended for illustrative purposes only. PAST PERFORMANCE DOES NOT GUARANTEE FUTURE RESULTS. CCM would like to thank StockCharts.com for helping Short Takes create great looking charts Short Takes is proudly powered by WordPress . Entries (RSS)