
Fed And BOJ On This Week’s Docket
Three key charts are trying to hold onto “breakout followed by a retest” looks as described on September 14. Given the market is bracing for a double-dose of central banks this week (Fed and Bank Of Japan), the charts below should provide some insight into the market’s risk-reward profile over the coming days and weeks. From Reuters:
The U.S. dollar fell from Friday’s more than two-week high against a basket of major currencies on Monday on expectations that any Bank of Japan action this week would not weaken the yen and the Federal Reserve would refrain from raising rates. The BOJ is due to conduct a comprehensive review of its policy framework, which combines negative interest rates with a massive asset-buying program. The BOJ and Fed meet on Sept. 20-21.
Economically-Sensitive High Beta
The High Beta ETF (SPHB) has higher weightings in materials (XLB), energy (XLE), and financials (XLF) relative to the S&P 500’s weightings (SPY). As shown in the chart below, this economically-sensitive investment is trying to hold the recent break above an area that has acted as resistance for a year. As recently as June 28 (point C below), SPHB looked to be on the ropes.

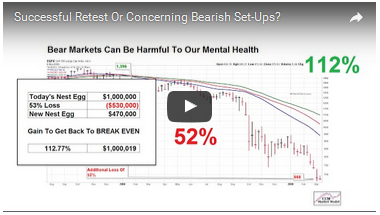
Is Recent Volatility Waving Red Flags?
This week’s stock market video provides insight into recent market volatility via historical examples. How much volatility can occur after a bullish breakout and within the context of a bullish trend? Why is capital preservation important?
After you click play, use the button in the lower-right corner of the video player to view in
full-screen mode. Hit Esc to exit full-screen mode.
S&P 500 Weekly
The weekly S&P 500 chart below is an updated version of the chart described on September 13. If the current weekly retest ends with the S&P 500 remaining above the long-term consolidation box, bullish probabilities would improve relative to bearish probabilities looking out weeks, months, and years.

Broad NYSE Composite
It comes as no surprise the broad stock market is hovering near a key level prior to announcements from two central banks. In October 2015, sellers thought 10,513 was relevant on the NYSE Composite. Sellers surfaced again near 10,511 in April 2016. Last Friday, the NYSE Composite closed in the same basic area at 10,532 (see chart below).

Is A Surprise Rate Hike Possible?
During the trading session Monday, the markets were pricing in an 85% probability the Fed does nothing with interest rates this week. Given the market’s near obsession with central bank liquidity, it is prudent to remain open to any and all market reactions this week. From MarketWatch:
Economists said they could not rule out a surprise rate hike this week, particularly since Yellen said “the case for an increase in the federal funds rate has strengthened in recent months.” …That said, Paul Ashworth, chief U.S. economist at Capital Economics, says that a surprise hike “just doesn’t fit Chair Yellen’s style.”
Charts And The Market’s Reaction
The longer high beta stocks, S&P 500, and NYSE Composite can stay above the levels outlined above, the better for the bullish case. Conversely, a sustained break below the key levels would increase bearish odds. We will learn something either way.
This entry was posted on Monday, September 19th, 2016 at 11:52 am and is filed under Stocks - U.S.. You can follow any responses to this entry through the RSS 2.0 feed. Both comments and pings are currently closed.
Copyright © 2016 Ciovacco Capital Management, LLC. All Rights Reserved. Chris Ciovacco is the Chief Investment Officer for Ciovacco Capital Management, LLC (CCM). Terms of Use. This article contains the current opinions of the author but not necessarily those of CCM. The opinions are subject to change without notice. This article is distributed for informational purposes only and should not be considered as investment advice or a recommendation of any particular security, strategy or investment product. The charts and comments are not recommendations to buy or sell any security. Market sectors and related ETFs are selected based on his opinion as to their importance in providing the viewer a comprehensive summary of market conditions for the featured period. Chart annotations are not predictive of any future market action rather they only demonstrate the opinion of the author as to a range of possibilities going forward. All material presented herein is believed to be reliable but we cannot attest to its accuracy. The information contained herein (including historical prices or values) has been obtained from sources that Ciovacco Capital Management (CCM) considers to be reliable; however, CCM makes no representation as to, or accepts any responsibility or liability for, the accuracy or completeness of the information contained herein or any decision made or action taken by you or any third party in reliance upon the data. Some results are derived using historical estimations from available data. Investment recommendations may change and readers are urged to check with tax and investment advisors before making any investment decisions. Opinions expressed in these reports may change without prior notice. This memorandum is based on information available to the public. No representation is made that it is accurate or complete. This memorandum is not an offer to buy or sell or a solicitation of an offer to buy or sell the securities mentioned. The investments discussed in this report may be unsuitable for investors depending on their specific investment objectives and financial position. Past performance is not necessarily a guide to future performance. The price or value of the investments to which this report relates, either directly or indirectly, may fall or rise against the interest of investors. All prices and yields contained in this report are subject to change without notice. This information is based on hypothetical assumptions and is intended for illustrative purposes only. PAST PERFORMANCE DOES NOT GUARANTEE FUTURE RESULTS. CCM would like to thank StockCharts.com for helping Short Takes create great looking charts Short Takes is proudly powered by WordPress . Entries (RSS)