Although there are 50,000 stock charts out there, it is not very common to find charts that are really special and have a very clear pattern. It is really rare to find “amazing” stock charts.
We have selected 5 stock charts which deserve your attention going into 2017. Their chart is not only beautiful, but also important as most of these stocks have a strategic meaning in the universe of markets.
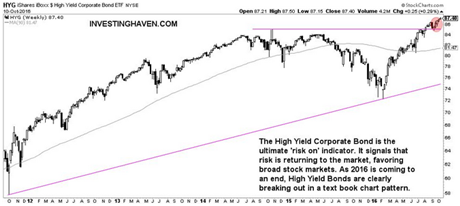
High Yield Corporate Bonds are a risk indicator. They signal risk on / risk off. In September of this year, this instrument broke out to all-time highs, clearing an 18-month consolidation pattern. This amazing stock chart signals that risk is returning into the markets in 2017.

Financials are out of grace as their yield on financial instruments is close to zero, given ongoing zero rate policies by central banks. However, that could be changing sooner rather than later. We expect financials stocks to move aggressively in 2017, as suggested by their relative strength which is the ratio between financials and the S&P 500. The long term triangle pattern visible on below chart suggests a breakout or breakdown is coming soon. That move will have a significant impact on stock markets in general.

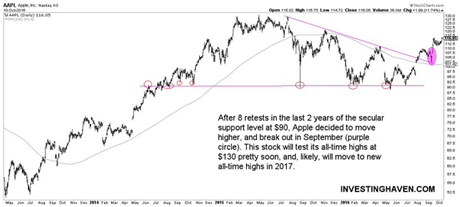
APPLE is a bellwether stock for the NASDAQ, a leader in the tech space. Its stock chart is truly amazing, and it suggests a clear direction for 2017. After 8 successful tests of secular support, in just 24 months, Apple decided to clear its descending trendline. It is moving higher with conviction, and will test its all-time highs pretty soon. We see new all-time highs in 2017 based on the pattern on its stock chart.

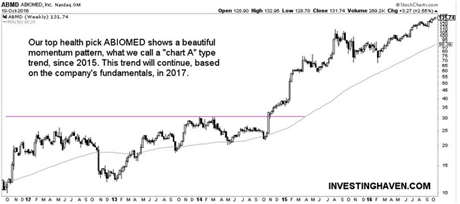
ABIOMED is a health care stock, and has an amazing momentum pattern on its stock chart. That pattern will likely extend its upward move in 2017.

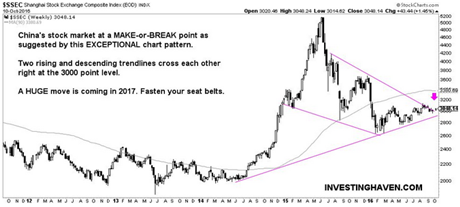
China’s stock market is known to be very volatile. Right now, the Shanghai stock market index has arrived at the apex of a long term pattern as seen on the next chart. A strong breakout or breakdown is imminent. 2017 will be an amazing year for China, the only question is will it be bullish or bearish? We bet on a bullish year.
