Based on current readings of their “sell side indicator”, Bank of America/Merrill Lynch (BOAML) recently wrote in a research note to clients:
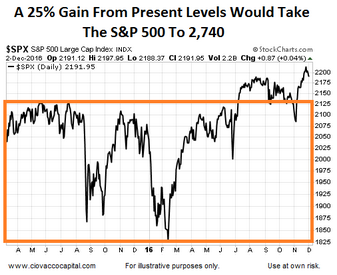
“Historically, when our indicator has been this low or lower, total returns over the subsequent 12 months have been positive 97% of the time, with median 12-month returns of +25%,”

Recommended Stock Allocations Remain Low
The BOAML indicator is based on the recommended stock allocations inside portfolios. A typical benchmark equity allocation is 60%-65% of a portfolio. Presently, the recommended allocation is significantly below that range, coming in at 51%. If the recommendations moved back to the historical mean, as they typically do, money would continue to flow out of bonds and into stocks. More information about the BOAML signal can be found on Yahoo Finance.
A Separate Rare Signal Also Leans Bullish
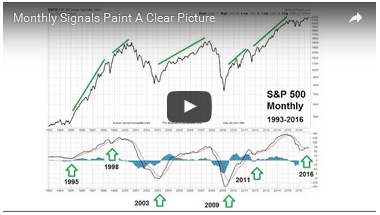
Has any other longer-term signal appeared recently that aligns with the possibility of double-digit stock gains over the next 12 months? Yes, this week’s stock market video covers a monthly S&P 500 momentum and trend signal that has occurred less than 10 times over the past 23 years. The signal was triggered at the end of November. Even more importantly, the signal was also triggered recently in numerous risk-on ETFs, such as small-caps (IWM), mid-caps (MDY), energy (XLE), copper (JJC), materials (XLB), and the total stock market (VTI), which may be due in part to allocation shifts based on President-elect Trump’s platform. Bearish signals have been triggered in defensive assets such as bonds (TLT), utilities (XLU), consumer staples (XLP), and healthcare (XLV), which may be due in part to post-election shifts regarding growth, earnings, taxes, deficits, and inflation.
After you click play, use the button in the lower-right corner of the video player to view in full-screen mode. Hit Esc to exit full-screen mode.

If you do not feel the signals outlined in the video are helpful, there is an easy solution…you can choose to ignore them and continue to make decisions based on your own criteria.
How Can These Signals Help Us?
Since there is no such thing as a perfect signal or indicator, the material covered in the video above and the BOAML indicator help us in two ways: (1) to better understand the probabilities of good things happening relative to bad things happening, and (2) to remain open to all outcomes, even better than expected outcomes given the market’s trendless and whipsaw pattern over the past 2-3 years.
The Weight Of The Evidence
Have any other signals occurred recently that align with the signals presented above? Yes, in recent months we have covered another rare trend signal, an extremely low volatility reading, and breakouts from long-term consolidation patterns.
Since the future is unknown and markets can do anything at any time, as always, we will remain open to all outcomes, including bearish outcomes. The data we have in hand aligns with a favorable risk-on environment; if the data deteriorates, we will make the necessary defensive adjustments.
These Signals Are Based On Facts
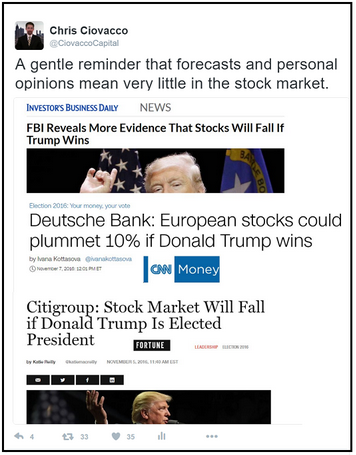
As noted in the tweet below, recent events (Brexit, U.S. election) remind us to take any forecast or opinion with a necessary grain of open-minded salt. The BOAML indicator and the broad array of recent monthly bullish MACD signals are based on facts, rather than opinions or forecasts. BOAML has historical data they can compare to present facts in hand. The MACD crosses presented in the video above are observable facts that can also be compared to historical facts, which is quite a bit different than an opinion or forecast of something that may or may not happen. If the facts change, the historical interpretation of the facts will change as well. Time will tell.

This entry was posted on Sunday, December 4th, 2016 at 9:46 am and is filed under Stocks - U.S.. You can follow any responses to this entry through the RSS 2.0 feed. Both comments and pings are currently closed.
Copyright © 2016 Ciovacco Capital Management, LLC. All Rights Reserved. Chris Ciovacco is the Chief Investment Officer for Ciovacco Capital Management, LLC (CCM). Terms of Use. This article contains the current opinions of the author but not necessarily those of CCM. The opinions are subject to change without notice. This article is distributed for informational purposes only and should not be considered as investment advice or a recommendation of any particular security, strategy or investment product. The charts and comments are not recommendations to buy or sell any security. Market sectors and related ETFs are selected based on his opinion as to their importance in providing the viewer a comprehensive summary of market conditions for the featured period. Chart annotations are not predictive of any future market action rather they only demonstrate the opinion of the author as to a range of possibilities going forward. All material presented herein is believed to be reliable but we cannot attest to its accuracy. The information contained herein (including historical prices or values) has been obtained from sources that Ciovacco Capital Management (CCM) considers to be reliable; however, CCM makes no representation as to, or accepts any responsibility or liability for, the accuracy or completeness of the information contained herein or any decision made or action taken by you or any third party in reliance upon the data. Some results are derived using historical estimations from available data. Investment recommendations may change and readers are urged to check with tax and investment advisors before making any investment decisions. Opinions expressed in these reports may change without prior notice. This memorandum is based on information available to the public. No representation is made that it is accurate or complete. This memorandum is not an offer to buy or sell or a solicitation of an offer to buy or sell the securities mentioned. The investments discussed in this report may be unsuitable for investors depending on their specific investment objectives and financial position. Past performance is not necessarily a guide to future performance. The price or value of the investments to which this report relates, either directly or indirectly, may fall or rise against the interest of investors. All prices and yields contained in this report are subject to change without notice. This information is based on hypothetical assumptions and is intended for illustrative purposes only. PAST PERFORMANCE DOES NOT GUARANTEE FUTURE RESULTS. CCM would like to thank StockCharts.com for helping Short Takes create great looking charts Short Takes is proudly powered by WordPress . Entries (RSS)