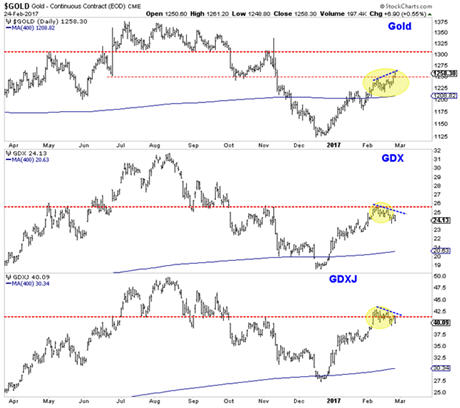
The early stages of Gold bull markets (this one included) are characterized by strong outperformance from the miners. They will lead the metals and turning points and register strong outperformance. We saw that in the early 2000s, late 2008 to early 2009 and we have seen it again over the past year. During the recent rebound, the miners rallied back to the “Trump” resistance while Gold is not yet close to doing so. However, unfortunately for bulls, while Gold is now pushing higher above key levels, the gold stocks are lagging. This new and recent underperformance suggests the gold stocks have made an interim peak and will remain entrenched in a correction or consolidation.
In the daily bar chart below we plot Gold, GDX and GDXJ. Gold closed the week up 1.6% and through resistance at $1250/oz while both GDX and GDXJ closed down over 2.5%. That is a strong negative divergence. Gold also eclipsed its early February high while miners did not. Do note that the miners already reached their early November peak (GDXJ exceeded it) while Gold remains some $40/oz below that peak. Buying in the miners reached an exhaustion point.

So if the gold stocks are correcting, how much downside potential is there? Upon first glance, we see 8% downside for GDX and 10% to 12% downside for GDXJ and TheDailyGold junior index. Note that the miners have already corrected roughly 6% to 9%. Keep an eye on GDX $22 because it is a confluence of strong support. It includes the 400-day exponential moving average which has provided support during many bull market corrections. The same can be said for the 350-day exponential moving average for TheDailyGold junior index. The secondary downside target for GDX and GDXJ would be the 400-day moving averages which are currently at $20 and $30 and rising.

After a roughly 40% to 50% rebound in only two months it should be no surprise that the mining sector has begun to soften around important resistance. Therefore, the recent underperformance in the shares relative to the metals (Silver included) rather than a surprise is confirmation that a correction in the shares has begun. We expect the metals to follow suit soon enough. Investors and traders are advised to accumulate their favorite names as the mining sector nears our downside targets.
For professional guidance in riding this new bull market, consider learning more about our premium service including our current favorite junior miners.
Jordan Roy-Byrne, CMT, MFTA
Jordan@TheDailyGold.com