Our working hypothesis is that
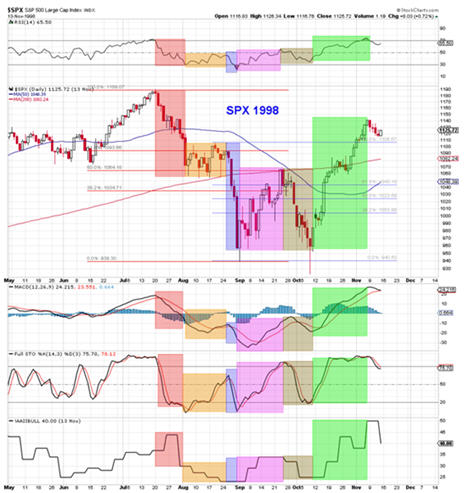
the dominant human emotion, fear leaves traces in the pricing history of the market which emerge as repetitive patterns. We search for these patterns and analyze the correlations between these patterns and market performance, in order to keep ourselves and our subscribers on the right side of the market. The trading in the S&P 500 in 1998 is one such pattern.
The chart below, shows the 1998 pattern color-highlighted according to relevant sections:
- Initial drop in orange,
- Range trade in yellow,
- Second way down in blue,
- First wave up in pink,
- Third way down in brown,
- Second wave up in green.

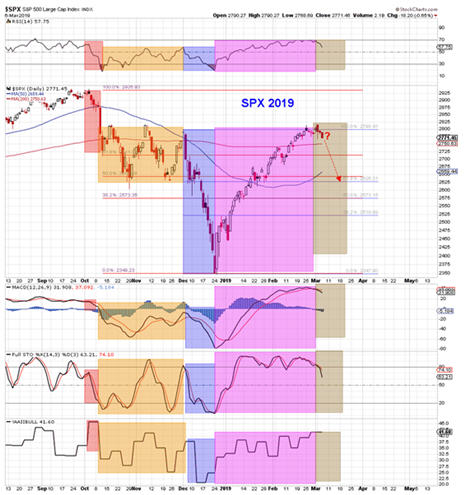
The next chart, shows the trading pattern of the past six-months, with the relavant sections highlighted in the same colors as in 1998. Notice the similarity to the 1998 pattern and that
we seem to be at the start of the third wave down (brown-highlight). In 1998, the S&P 500 pulled all the way back to test the low, but it may not fall that far this time, considering that in 1998 it did not rise to test the top of the range-trade, like it has in 2019, it is reasonable that it may not fall as far this time. Patterns do not replicate
exactly, they are
similar or
rhyming in nature (chart below).

We expect the pattern to continue replicating and the S&P 500 to drop down to the 2625 level. If that support holds, then the second wave up would begin (green-highlight). If it breaches that support, the next support is at 2570.
Join us at www.angtraders.com and replicate our trades and profits.