Technical analyst Clive Maund explains why he expects this company's shares to break out.

BNK Petroleum Inc. (BKX:TSX; BNKPF:OTCQX) has put in a disappointing performance since we went for it about a month ago—it has refused to break out of its downtrend and has instead dropped to a new low, although not by much, but the good news is that buying on huge volume has started to kick in, which we can see on its latest 3-month chart below. In particular there were two up days on huge volume at the start of this month that, together with the curious high volume day in the middle of February that looks like a "cross trade" give rise to the suspicion that something is going on here—it looks like some powerful buyer is taking a position—and it is definitely worth noting here that there has been a big volume buildup in the US traded stock since the start of the year, with the On-balance Volume line surging in recent weeks, and the chart for this market, shown lower down the page, has been added later after the close of trading on Monday 11th.
This action is viewed as greatly increasing the chances that the upside breakout that we have been looking for is going to occur soon.

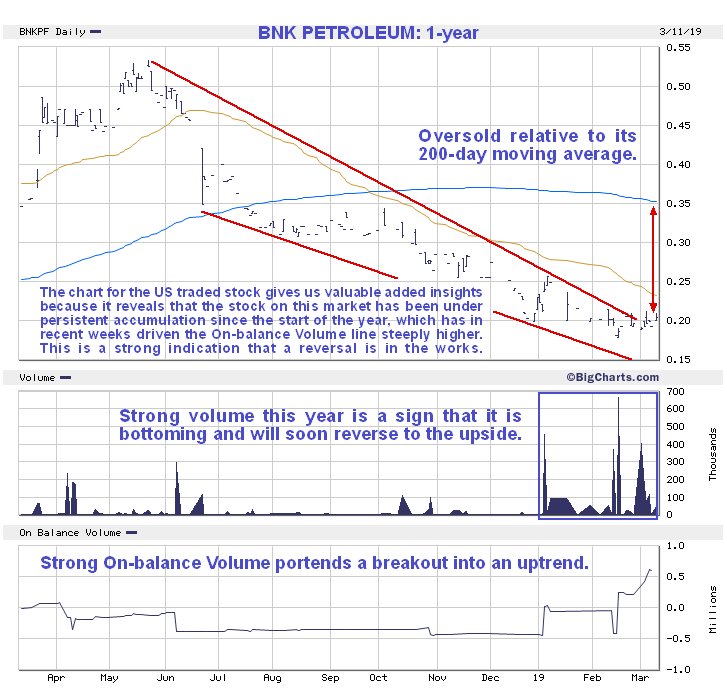
On the 1-year chart you can see why we are expecting an upside breakout soon—the large bullish Falling Wedge shown on this chart is now closing up with downside momentum dropping out, as shown by the MACD indicator. Thus, the strange very high volume upside days in recent weeks, especially in the US traded stock, are viewed as evidence that someone—or something—is taking positions at good prices ahead of some as yet unknown development. The oil price looks set to rise short-term which is a supporting factor.

The chart for the U.S. traded stock has just been added after the close of trading on the Monday 11th, the reason being that it shows persistent accumulation from the start of the year that has driven the On-balance Volume line steeply higher in recent weeks. This is a strong indication that it is basing here and readying to break out upside, probably soon.
Also added after the close on Monday 11th is this link to a news release by the company at 8.24 ET ANNOUNCING A 26% BOE INCREASE IN 2018 YEAR-END PROVED RESERVES.
We therefore stay long and fresh purchases are in order here with a stop at say C$0.238, in case it disappoints and steps lower again.
BNK Petroleum website.
BNK Petroleum Inc, BKX.TSX, BNKPF on OTC, closed at C$0.265, $0.192 on 8th March 2019.