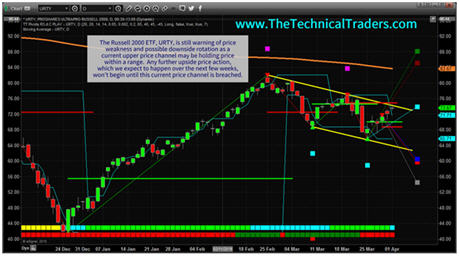
While we have recently suggested the US stock market is poised for further upside price activity with a moderately strong upside price “bias”, our researchers continue to believe the US stock markets will not break out to the upside until the Russell 2000 breaks the current price channel, Bull Flag, formation. Even though the US stock markets open with a gap higher this week, skilled traders must pay attention to how the Mid-Caps and the Russell 2000 are moving throughout this move.
As we continue to advise our clients that the upside pricing cycle in the
US stock market is being underestimated, see this research post: we also believe that increased volatility and price rotation will continue to drive larger rotations in price before the final breakout upside move takes place. We want to continue to warn traders that we still don't have any confirmed upside breakout with price continuing to stay within this price channel in the Russell 2000. Eventually, when and if the price does breakout to the upside, we will have a very clear indication that continued higher prices and a larger upside move is happening. Until then, we need to stay cautious about the types and levels of rotation that continue within the markets.

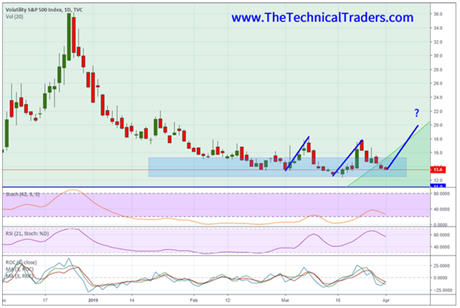
Recently, volatility has started to increase as can be seen in this VIX chart. If the Russell 2000 is not able to break this trend channel with this current upside price move, then we fully expect continued price rotation in the US stock markets and another increase in the VIX as this rotation takes place. The NQ recently rotated downward by nearly 4% while historical volatility continues to narrow. When volatility diminishes in extended price trends, we've learned to expect aggressive price rotation can become more of a concern. We expect the VIX to spike above 16~18 on moderate volatility as we get closer to the cycle inflection date near June/July 2019.
 Volatility Index - VIX chart by TradingView
Overall, our researchers believe the upside price bias in the US stock market will continue for another 30+ days as our research and predictions regarding
precious metals and the longer term
equities price cycles continue to play out. Skilled traders need to be aware that this upside price bias may include larger price rotation and volatility as we get closer to the May/June/July 2019 cycle inflection points. Stay aware of the risks as 4~6%+ price rotations should be expected over the next 30+ days throughout this upside price bias.
Do you want to find a team of dedicated researchers and traders that can help you find and execute better trades in 2019 and beyond? Please visit
www.TheTechnicalTraders.com to learn how we can help you prepare for the big moves in the global markets and find better opportunities for greater success in the future. Our team of researchers and traders continue to scan the markets for new trades and unique opportunities.
Chris Vermeulen