The big picture fundamentals for precious metals have been trending more bullish in recent months as expectations for the Federal Reserve went from a few rate hikes in 2019 to an expectation of a rate cut within the next 12 months. That is aligned with the peak in the 2-year yield and growing concerns over slowing growth globally.
However, that doesn’t preclude a temporary improvement in the economy and markets. China is stimulating again. Global equities have recovered and the S&P 500 is on the cusp of a new high.
All of this means a Fed rate cut in the next 12 months is less likely. Not unlikely but less likely.
Precious Metals have been trading on Fed rate expectations for a while. Higher highs in equities and some stabilization in the economy will chip away at expectations for a rate cut and as a result, some bearish price action is showing up in the precious metals sector.
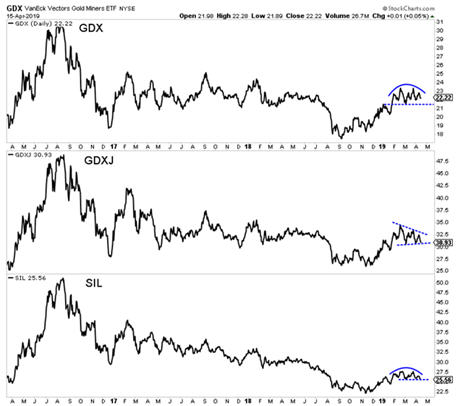
Below we plot the daily line charts of the gold and silver stocks.
They have formed bearish patterns with the silver stocks (SIL) leading to the downside followed by GDXJ while GDX has held up the best. These charts need to hold their early March low to avoid a break to the downside.

Turning to the metals, we find Silver has been leading the entire complex lower. It has found temporary support just below $15.00.
Meanwhile, Gold has formed a bearish pattern and if it loses support at $1280 will likely dump to its 200-day moving average at $1253 and probably lower.

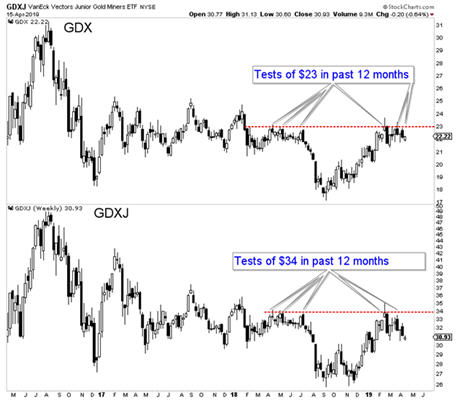
Circling back to the gold stocks, I do want to note the weekly candle charts because they illustrate the big picture prognosis.
We can see that for GDX and GDXJ the critical levels are clearly $23 and $34. The gold stocks have failed to break resistance for now but it’s clear that a weekly close above those levels would signal a bull market.

If the miners and Gold break lower then it’s no reason to throw in the towel. We would not be surprised if the next low the miners make could be the last one before a bull run begins.
In the meantime, the question is will it be a higher low or will the miners form huge double bottoms at $18 and $26?
The weeks and months ahead should be an especially opportune time to position yourself in this sector. We will be looking for anything we missed in recent months that gives us a second chance opportunity.
To learn what stocks we own and intend to buy that have 3x to 5x potential, consider learning more about our premium service.