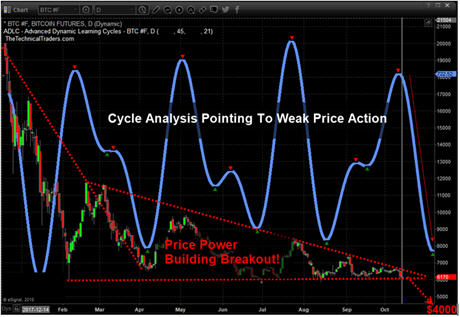
Last year just days before the big Bitcoin breakdown we notified everyone publicly to get ready for a swift drop from $6000 to $4000 which played out perfectly within a few days. Our cycle system and technical analysis skills combined can pack a powerful punch and this one of those incredible moves where the stars aligned for us as traders.
October 12 2018 – Post and Chart Here

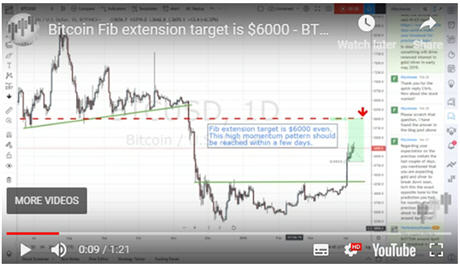
We then further updated our followers in March of this year that a breakout was about to take place and a run to $6000 should take place. After that upside breakout move on April 8
th we posted this video further confirming $5800-$6000 was still the target.

Today/May Bitcoin appears to be setting up a broader top formation that suggests another move lower is about to unfold.
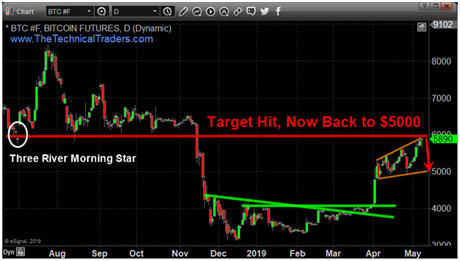
This first Daily chart highlights both support and resistance in Bitcoin. The Resistance goes all the way back to July 2018 where a Three River Morning Star pattern setup a gap with a Doji Star formation. This setup the support level that was ultimately broken in November 2018. Support formed near $4000 in early 2019 with similar types of gap formations. This support level was ultimately broken in April 2019 with a move back up to resistance near $6000.

We believe the setup of the most recent price activity is setting up a classic three mountains top formation. A weak price rotation prompting a downside price move right now could be a short term ultimately top with next support near $5000. We believe a fairly quick downside price move toward the $4400 level (or lower) – near support.
Once price move to near the $4400 price level, or lower, if the support level is broken, we could see the price of Bitcoin fall all the way towards the $3500 level or lower. Fibonacci price theory suggests the failed high price move, near $7500, would represent a major failed high. This failure suggests a move lower attempting to establish a new price low. For this to happen, the price of Bitcoin would have to fall below $3000 which may sound crazy, but so was $20,000 bitcoin!
Watch for a reversal to unfold in the coming days, could be another opportunity to profit from another crypto currency collapse. Any failure of this breakdown/reversal move would suggest Bitcoin is setting up a new Pennant/Flag formation where price will trade sideways before prompting a bigger breakout move. We believe a price breakdown is about to unfold and we expect prices to fall below $4400 within 14 to 28 days.
If you want to become a technical trader and pull money from the markets during times when most others cannot be sure to join the
Wealth Trading Newsletter today. Plus, for a few days only I’m giving away and shipping Free Silver Rounds to subscribers who join our select membership levels.
Chris Vermeulen
www.TheTechnicalTraders.com