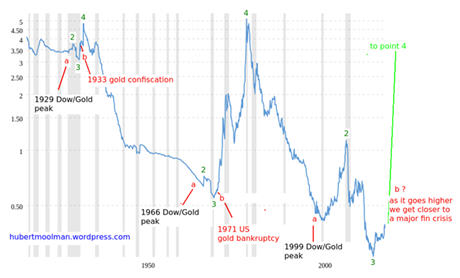
Previously, I have shown how we could be close to major financial/monetary crisis. The following chart that shows the ratio of gold to the monetary base was used:

The chart shows the ratio of the gold price to the St. Louis Adjusted Monetary Base back to 1918. That is the gold price in US dollars divided by the St. Louis Adjusted Monetary Base in billions of US dollars. (from macrotrends.com)
More details about the chart and original commentary
here.
The bottom at point 3 is now virtually confirmed and we could soon have an event similar to the 1933 gold confiscation (bankruptcy) and the 1971 announcement where the US ended the dollar convertibility to gold (at a fixed rate).
Although both of the historic events were significant, they did not occur during a stock market crash or during a recession. There is a huge potential that the coming event could happen during a major stock market crash and recession.
Therefore, the coming monetary event could be the cause (or at the center) of the coming crisis, whereas with the previous two they were as a result of an ongoing crisis, and came towards the end to “correct” the situation.
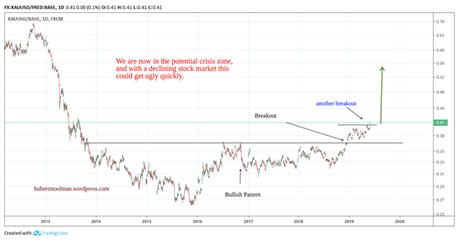
Below, is a more short-term chart of the ratio of the gold price to the monetary base:

The ratio has made another breakout and is likely to go higher quickly . There is no certainty when the crisis would hit; however, it will come some time during the rally and after/during the stock market crash. Physical gold and silver will likely be key assets during this crisis.
For more on this and this kind of fractal analysis, you are welcome to subscribe to my
premium service. I have also recently completed a
Silver Fractal Analysis Report as well as a
Gold Fractal Analysis Report.