We have written for over a year about the historical importance of the shift in Federal Reserve policy. We’ve noted that over the past 65 years in 11 of 13 rate cut cycles the gold stocks have enjoyed tremendous gains. The historical data shows an average gain of over 170% and median gain of almost 150%.
As of Tuesday morning, the market showed an 84% chance of a rate cut by the Fed meeting in January 2020. That’s only 8 months away!
With that said, it appears odd that the gold stocks are struggling. The market tends to anticipate and discount potential news in advance. One would expect the gold stocks to begin to “price in” a rate cut, given that the market is nearly convinced a rate cut is on the horizon.
However, the historical data argues otherwise. The median and average bottom around the first rate cut is typically one and two months before that first rate cut.
The likely months for the first rate cut figure to be either September or December. If the Fed cuts rates in September, then the data argues for a bottom in August or late July. If the Fed were to cut in December, then its possible we could see a bottom earlier than a month before.
The timeline for a potential bottom in the gold stocks could line up well with the current technical outlook.
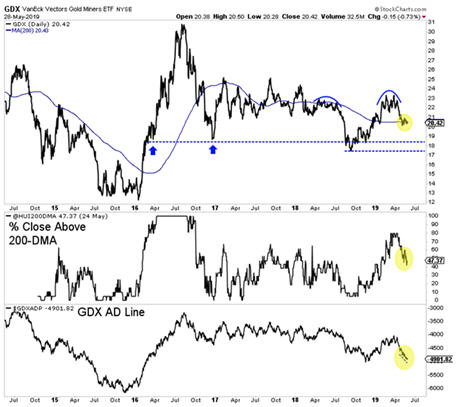
In the chart below we plot GDX along with the percentage of stocks that closed above the 200-day moving average (in the HUI) and the GDX advance decline (AD) line.

GDX is oversold on a short-term basis but remains weak. It’s AD line (an important breadth indicator) is showing a negative divergence.
Gold stocks are not oversold on a 200-day basis. As you can see, 47% of the HUI (GDX sans royalty companies) closed above the 200-day moving average.
Ultimately, I’d love to see GDX bottom around $18 in August with that aforementioned percentage below 20%. A double bottom prior to a Fed rate cut in September would trigger a strong run into year end.
In any case, the gold stocks could be setting up for a mid summer bottom and one that would be really significant if the Fed cuts rates in September. We continue to look at individual companies that are trading at excellent values and have important upcoming summer catalysts.
To learn what stocks we own and intend to buy that have 3x to 5x potential, consider learning more about our premium service.