We believe the current price rotation is just the beginning of something much bigger. Over the past 16+ months, we've been calling these tops and bottoms many months in advance. In February/March 2018, we called the bottom and initiated a call that the US stock market would rally to establish new all-time highs. Very few believed us at that time, but the markets did exactly what we predicted. In September 2018, we called for the markets to experience weakness, pause after a quick downturn, then establish an “ultimate bottom” near November 2018 before rallying back to near all-time highs again. At that time, everyone was betting the new market crash had taken over Wall Street and we were really the only ones suggesting the US stock market would rally back from the December 2018 lows. Guess what happened? The markets did exactly what we predicted and went on to hit new highs months later.
We've recently
called the precious metals move perfectly with our originating research being done in October 2018. We called the Oil downturn in 2018 as well as the rally starting near December 2018. Now, we are going to share with you some incredible market insights and help you prepare for what will likely become the most frustrating next six months of trading for everyone.
Why is it going to be frustrating? Because everyone has already made up their minds as to what they expect to happen in the markets and WHY. We read a report today from an analyst that suggested he “moved into a defensive position and initiated positions in Inverse ETFs and Put Options”. Probably a smart move if he timed it right. What he's going to do over the next 6 months will either make him a king or a pauper.
The fact is that the US stock market has initiated a very moderate downside price rotation recently and multiple levels of support must be breached before we could consider any of the recent downside pricing pressure as a “major trend reversal”. We believe many of these analysts are hyperventilating with regards to this move and seeing what they want to see from it – THE BEAR MARKET.
At this time, we do not agree with this narrative. Yes, the US stock market is under pricing pressure. The US/China trade deal is far from completed and the new US/Mexico tariffs are sure to roil the markets. Europe has just completed EU elections and must continue to navigate the hard questions of future management and opportunity with a BREXIT hanging over everyone's heads. The Prime Minister of Malaysia is calling for a new “gold backed SE Asian currency” to help prevent the wild currency valuations as Malaysia saw in the mid-1990s. The US Presidential election cycle is just 15 months away and it is sure to be a blood-bath in some ways.
Could it be the start of the bear market?? Maybe, but our research suggests otherwise.
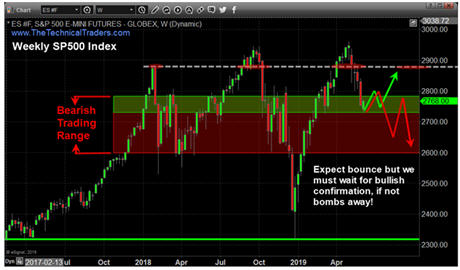
Our research suggests there is still another chance that the US stock market could bottom after these recent lows find support and rally back to near all-time highs again. Be cautious about how we stated this... “could bottom after these recent lows find support and rally back to near all-time highs again” does not mean “rally beyond recent highs” or “another leg to the upside will take place”. It means that we believe the current support will prompt a brief price rally back to “near all-time highs” before the end of August 2019.
This Weekly ES chart highlights the support levels we are watching and the peak zone near $2961. We believe the current support levels will attempt to provide a floor for price above $2630 and will prompt an upside price channel that will likely see price climb higher from recent lows.
The bottom line here for the broad stock market is that we should see bounce over the next couple weeks, then we follow the market higher with a big rally or short a collapse in price.

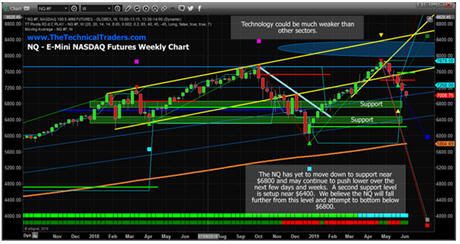
This chart is a little noisy with analysis and
our custom indicator lines but it shows key analysis levels. The same type of setup is also taking place in the NQ – although we believe the NQ may have a bit further downside price risk than the ES or YM at the moment. We believe the support levels near $6800 and $6400 will act as a price floor and attempt to drive price moderately higher over the next 25 to 45 days. We believe the NQ will come under increased price pressure because of a capital rotation away from risk in Technology and future risk factors.

The YM is setting up very similar to the ES. Very clear support and the current price level is still relatively bullish compared to the two most recent bigger downside price moves. The idea that analysts could call this “The Big One” with little to know price confirmation is very confusing. We believe support above $23,400 will likely hold and price will begin a moderate upside price move (within a channel/pennant formation) over the next 25 to 40+ days in the YM.

One very clear exception to this analysis would be a very clear price breakdown below the lowest support level while attempting to target the December 2018 lows. Should this happen over the next 30 to 60 days without any sign of the support rotation and upward price channel we are expecting, then we would consider this analysis to have failed and we could be looking at a much bigger downside price move in the US stock markets. At this point, we don't believe this will happen UNLESS some massive US or foreign crisis event unfolds over the next 30 to 60+ days.
We believe a shift in the “Capital Shift” process we have been discussing for the past 2+ years is still taking place. This is a “risk off” move prompted by a renewed FEAR level and currency price trends over the past 6+ months.
This currency chart clearly shows everyone is selling their currency and moving into what they believe is the safest currency which is the USD.

We believe Capital Shift process will go through a weakening process while fear drives investors out of high performing assets. This process will likely shift back towards searching for undervalued US equities as global investors seek new opportunities after these support levels prompt a base. The hunt to find returns will eventually lead everyone back into the US stock market as there is too much turmoil in the global markets currently.
If you missed this move, sit back and wait for these support levels to settle and then look for new trade opportunities. There will be lots of time to get into the BIG SHORT TRADE when it finally sets up and confirms.
BECOME A TECHNICAL TRADER TODAY AND
TRADE WHAT MATTERS – PRICE ACTION!
CLICK HERE
Chris Vermeulen
Technical Traders Ltd.