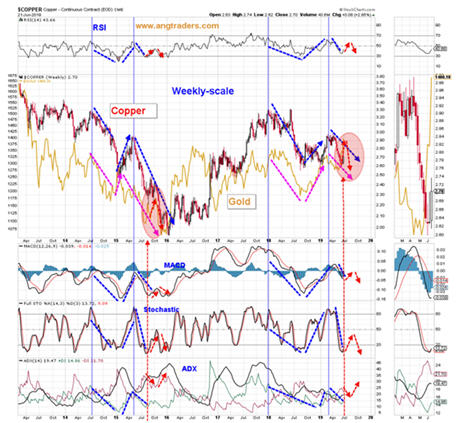
Gold rallied strongly this week, and without thinking about the causes, we see that the movement continues to fit with the patterns we have been following. The chart below shows the copper/gold pattern from 2014-15 and its replication this year. If this pattern-replication continues, then, after some possible further increases, gold and copper should fall to make lower-lows (chart below).

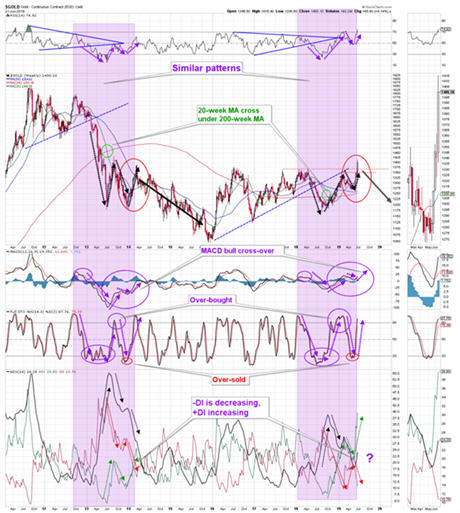
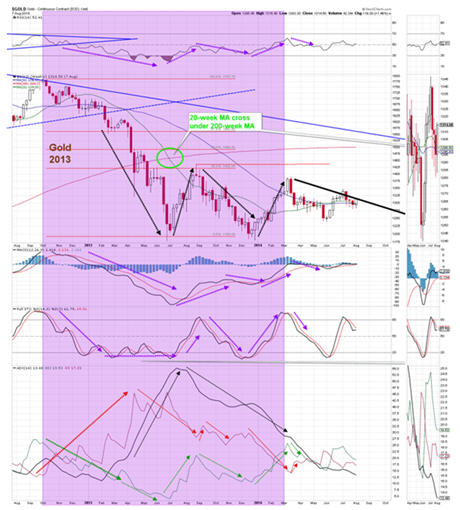
The strong rally in gold also continues to fit the 2013-14 pattern. After a little more price appreciation, gold should come back down like it did in 2014 (charts below).

A closer look at 2013-14:

A closer look at 2018-19:

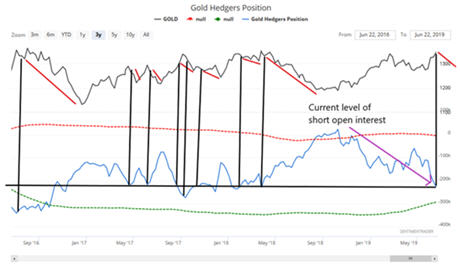
When gold hedgers have been at short levels like we have today (black horizontal line on chart below), gold has made gains only 25% of the time.
 According to Sentimentrader, when the dollar falls below its 200-day MA after a long run-up (the current situation as of Friday), the dollar and the SPX tend to move higher over several months, and gold tends to drop (tables below).
 In summary: Gold may rise further in the short-term, but the balance of probabilities is that it will decline in price over the next 6-months.
Join us at www.angtraders.com and replicate our trades and profits.