Technical analyst Clive Maund charts the reasons why the recent gold breakout is genuine.
It has been a truly glorious month for gold, and the purpose of this update is to point out firstly that the gold breakout of the past week was genuine and secondly that any short-term reaction back as far as $1,380 or even $1,370 will not negate the breakout—instead it should be seized upon as an opportunity to build positions across the sector, especially in trampled down undervalued silver stocks. Silver broke higher last week on its strongest upside volume since its frothy top in 2011 and on its second highest upside volume ever.
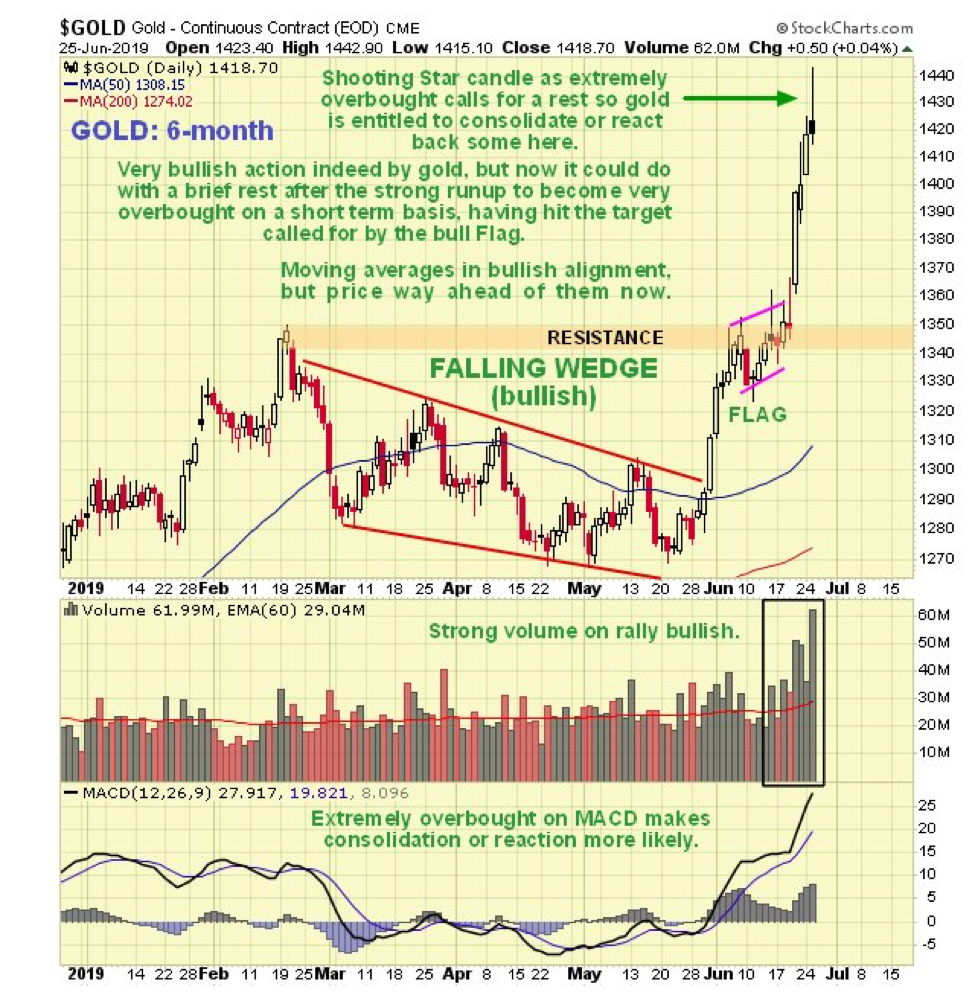
On the six-month gold chart we can see the impressive breakout run-up of recent days, which has taken gold to a flag target that it has reached in an extremely overbought state. This means it is entitled to take a rest here, and that is what it is doing.
Two other factors calling for immediate consolidation/reaction are the appearance of a short-term, bearish, shooting-star candlestick on the chart yesterday, and the fact that it has run way ahead of its moving averages, which are now in strongly bullish alignment. We should not be surprised, therefore, to see it react back in the near term, to perhaps $1,380 or even $1,370, which will have folks doubting that the gold breakout is genuine. But it is genuine, as made clear by the strong volume on the breakout, so we will use any such reaction as a buying opportunity.

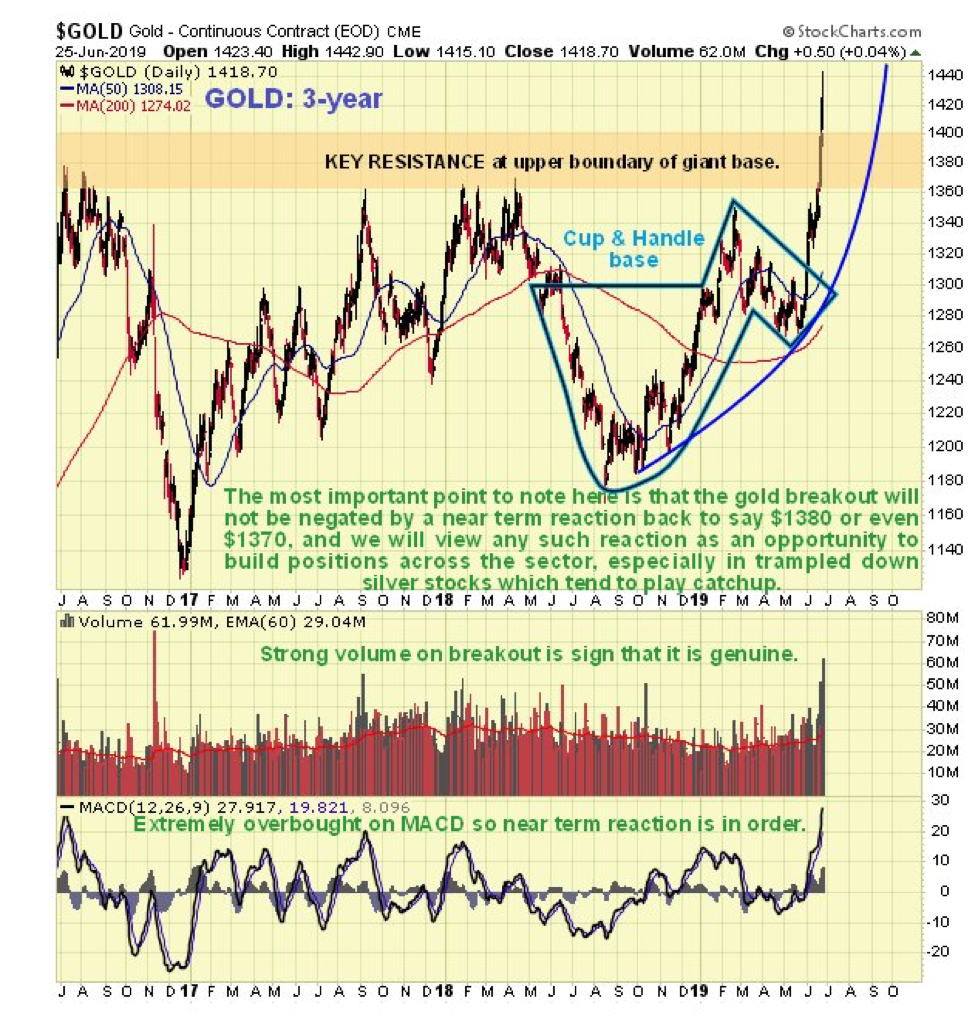
The three-year chart gives us useful perspective on the breakout, enabling us to see that it occurred from a fine cup-and-handle base that we had delineated quite a while back. This chart also makes clear how steep the recent rise has been and shows that it has become extremely overbought on its MACD (moving average convergence/divergence), which means that it could do with a rest now.
However, that said, a major and probably epochal breakout is occurring here, so gold is perfectly entitled to accelerate away to the upside, and is thus not expected to tarry for long. So any near-term weakness may be bought aggressively.

Fundamentally, gold has everything going for it here. Central banks are buying it hand-over-fist, major powers that have been bullied and threatened by the U.S., like China and Russia, are buying it hand-over-fist, in readiness for burying the dollar. The Fed and other central banks have painted themselves into a corner, where the only thing they can think of doing is printing money like crazy to try to stop the system from imploding. The world faces the grim prospect of massive unprecedented quantitative easing (state counterfeiting), negative interest rates, and the outright plunder of bank accounts, called bail-ins (theft), and they may even resort to thieving from retirement funds. Perhaps we can preempt them a bit here by thinking up a euphemism for it. What about PERG (Pensioners Expedite Rescue of Government)? It is a perfect storm that could cause gold to skyrocket.
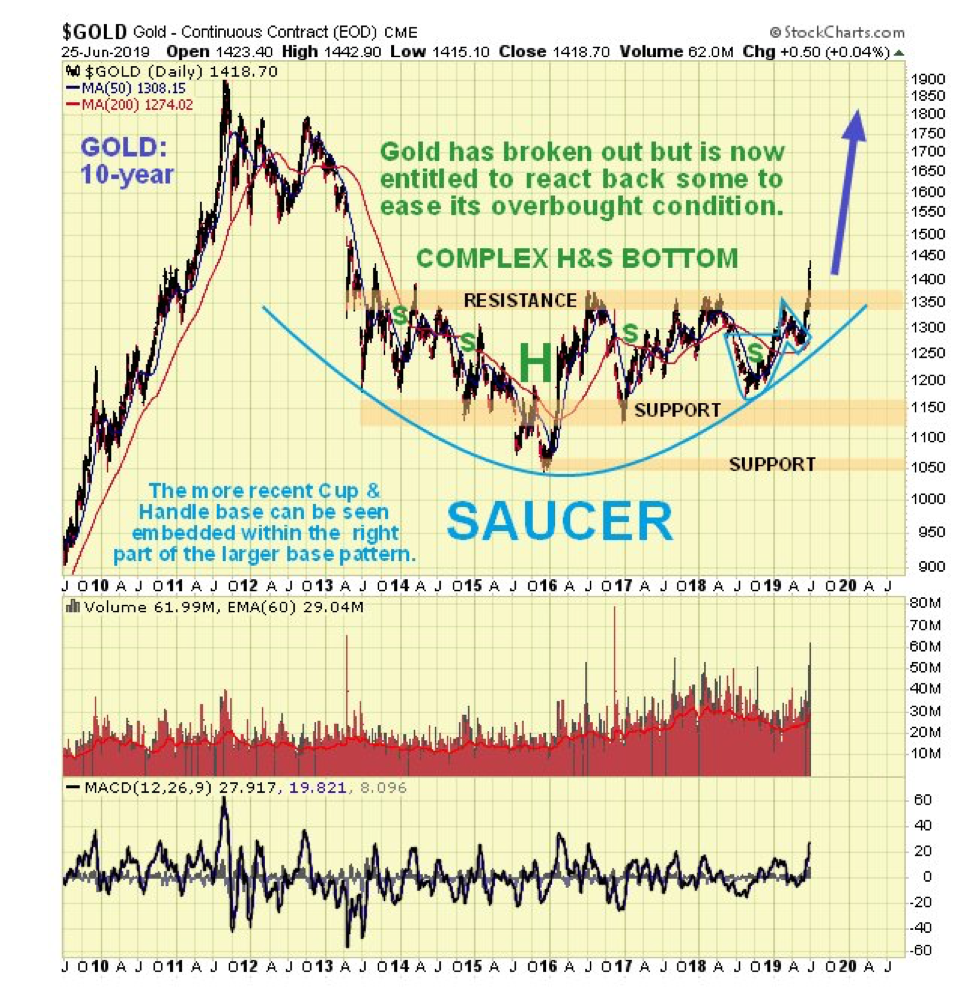
Finally, let us wheel out our 10-year chart for gold yet again (nice, easy, cut-and-paste job) to remind ourselves of the enormous significance of this gold breakout. As we see, gold is breaking out of a giant six-year-long head-and-shoulders bottom/saucer base pattern, which actually may be considered to be a lengthy reaction within a much larger bull market going to the early 2000s. This giant base pattern is capable of supporting a massive bull market that looks set to go way beyond the earlier highs in 2011.

Originally posted on CliveMaund.com at 9.30 am EDT on 26th June 2019.
Clive Maund has been president of www.clivemaund.com, a successful resource sector website, since its inception in 2003. He has 30 years' experience in technical analysis and has worked for banks, commodity brokers and stockbrokers in the City of London. He holds a Diploma in Technical Analysis from the UK Society of Technical Analysts.
Disclosure:
1) Statements and opinions expressed are the opinions of Clive Maund and not of Streetwise Reports or its officers. Clive Maund is wholly responsible for the validity of the statements. Streetwise Reports was not involved in the content preparation. Clive Maund was not paid by Streetwise Reports LLC for this article. Streetwise Reports was not paid by the author to publish or syndicate this article.
2) This article does not constitute investment advice. Each reader is encouraged to consult with his or her individual financial professional and any action a reader takes as a result of information presented here is his or her own responsibility. By opening this page, each reader accepts and agrees to Streetwise Reports' terms of use and full legal disclaimer. This article is not a solicitation for investment. Streetwise Reports does not render general or specific investment advice and the information on Streetwise Reports should not be considered a recommendation to buy or sell any security. Streetwise Reports does not endorse or recommend the business, products, services or securities of any company mentioned on Streetwise Reports.
3) From time to time, Streetwise Reports LLC and its directors, officers, employees or members of their families, as well as persons interviewed for articles and interviews on the site, may have a long or short position in securities mentioned. Directors, officers, employees or members of their immediate families are prohibited from making purchases and/or sales of those securities in the open market or otherwise from the time of the interview or the decision to write an article until three business days after the publication of the interview or article. The foregoing prohibition does not apply to articles that in substance only restate previously published company releases.
Charts provided by the author.
CliveMaund.com Disclosure:
The above represents the opinion and analysis of Mr Maund, based on data available to him, at the time of writing. Mr. Maund's opinions are his own, and are not a recommendation or an offer to buy or sell securities. Mr. Maund is an independent analyst who receives no compensation of any kind from any groups, individuals or corporations mentioned in his reports. As trading and investing in any financial markets may involve serious risk of loss, Mr. Maund recommends that you consult with a qualified investment advisor, one licensed by appropriate regulatory agencies in your legal jurisdiction and do your own due diligence and research when making any kind of a transaction with financial ramifications. Although a qualified and experienced stock market analyst, Clive Maund is not a Registered Securities Advisor. Therefore Mr. Maund's opinions on the market and stocks can only be construed as a solicitation to buy and sell securities when they are subject to the prior approval and endorsement of a Registered Securities Advisor operating in accordance with the appropriate regulations in your area of jurisdiction.