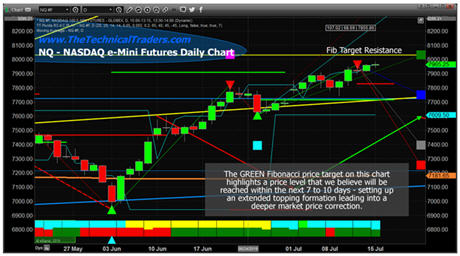
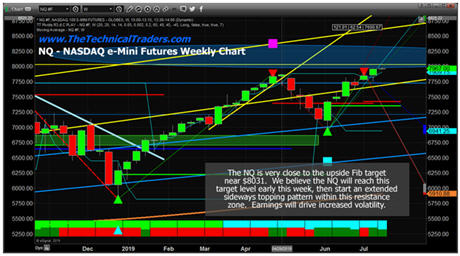
With earnings data starting to hit the markets and recent news that China's economic activity levels shrank to levels not seen in nearly 30 years, we believe our proprietary Fibonacci price modeling system is showing us a target level in the NASDAQ (NQ) that will likely be reached within the next 7 to 10 days. We believe once this target level is reached, the US stock market will immediately begin an extended topping formation with sideways price action and increased volatility) which will culminate in our August 19, 2019 setup date for a much deeper price correction.
At this time, traders should start to prepare for this topping event and prepare for price resistance to be found as the NQ nears this 8031 level – only 60 pts away. If you are sitting on a bunch of profitable long trades, our suggestion would be to scale back 50% to 60% of these open positions and prepare for a top setup to begin within 7 to 10 days. The volatility we expect to see over the next 30 days will likely be 2x or 3x current levels.
Nasdaq Daily Chart
This Daily NQ chart highlights the Fib Target Resistance level and shows our proprietary Fibonacci price modeling system's current downside price targets (7760, 7400 and 7265). These downside price target will change as the new price peak is established near the 8031 price level.
 Nasdaq Weekly Chart
This NQ weekly chart highlights the same suggested resistance level (the YELLOW LINE drawn near the recent highs) and highlights deeper Weekly Fibonacci downside price targets near 6950, 6000 and 5950.
Our expectations are that economic weakness and price rotation will set up and begin a downside price move on or near August 19, 2019, based on our cycle research. We believe this move will initially target a -6 to -9% downside price move, then extend into a much deeper price decline ending near the start of 2020 or within Q1 of 2020.

See my
current trend and trade signals for the SP500 index here.
CONCLUSION:
Our researchers believe traders should be actively scaling back existing long positions in preparation for this top setup. Key psychological levels have already been reached and the minute the NQ breaks above 8000, the key Fibonacci target level and the key psychological level (8000) become critical elements for the market top formation.
Now is the time to plan and prepare for these incredible price swings in the markets. The next 18-24 months are certain to present technical traders with countless opportunities for success with these bigger price moves.
Our recent calls in the markets have resulted in over 42% in total gains over the past 60 days. Isn’t it time you learned how
www.TheTechnicalTraders.com can help you find and time better trades?
BECOME A TECHNICAL TRADER AND PROFIT WITH US
Chris Vermeulen
Technical Traders Ltd.